如何在 r 中的绘图中添加上标和下标
您可以使用以下基本语法向 R 中的绘图添加上标或下标:
 #define expression with superscript
x_expression <- expression(x^ 3 ~ variable ~ label)

#define expression with subscript
y_expression <- expression(y[ 3 ] ~ variable ~ label)

#add expressions to axis labels
plot(x, y, xlab = x_expression, ylab = y_expression)
以下示例展示了如何在实践中使用此语法。
示例 1:向轴标签添加指数
以下代码显示如何将指数添加到 R 中绘图的轴标签:
 #define data
x <- c(1, 2, 3, 4, 5, 6, 7, 8)
y <- c(9, 12, 14, 16, 15, 19, 26, 29)

#define x and y-axis labels with superscripts
x_expression <- expression(x^3 ~ variable ~ label)
y_expression <- expression(y^3 ~ variable ~ label)

#createplot
plot(x, y, xlab = x_expression, ylab = y_expression)

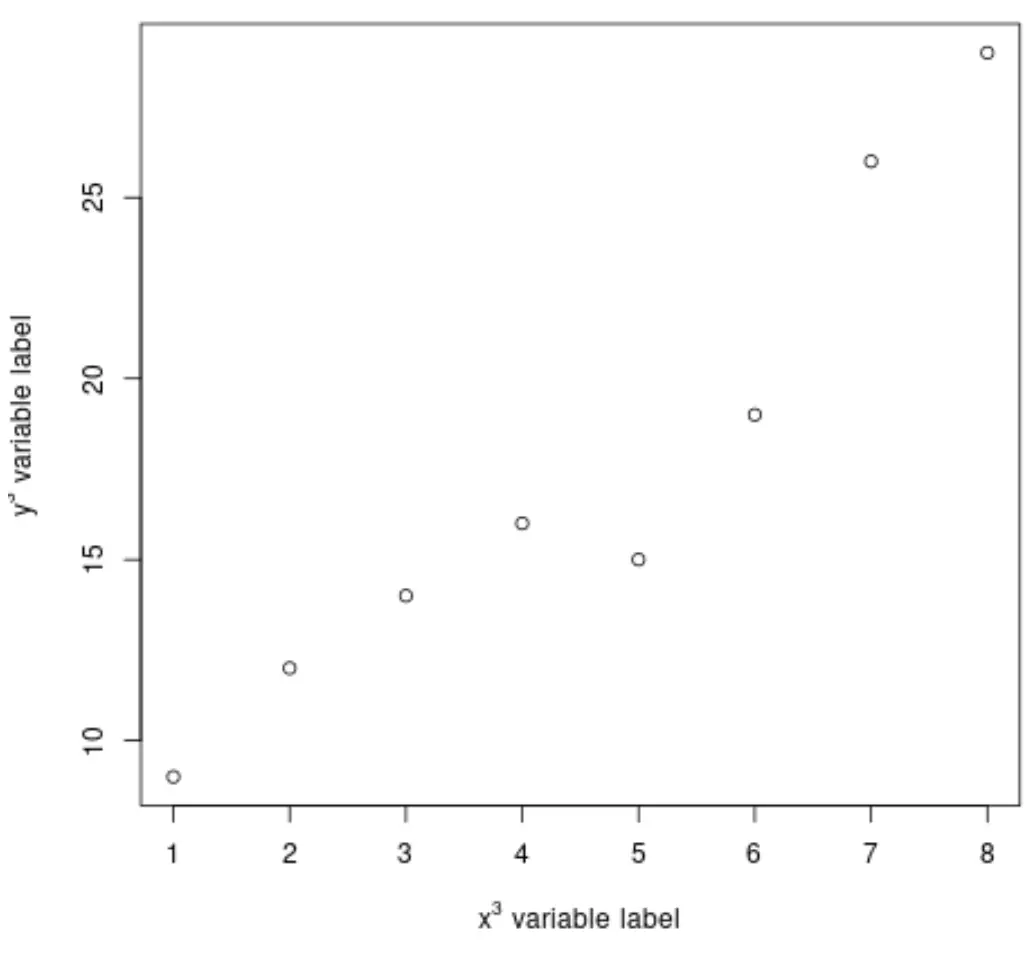
请注意,X 轴和 Y 轴的标签中都有一个指数。
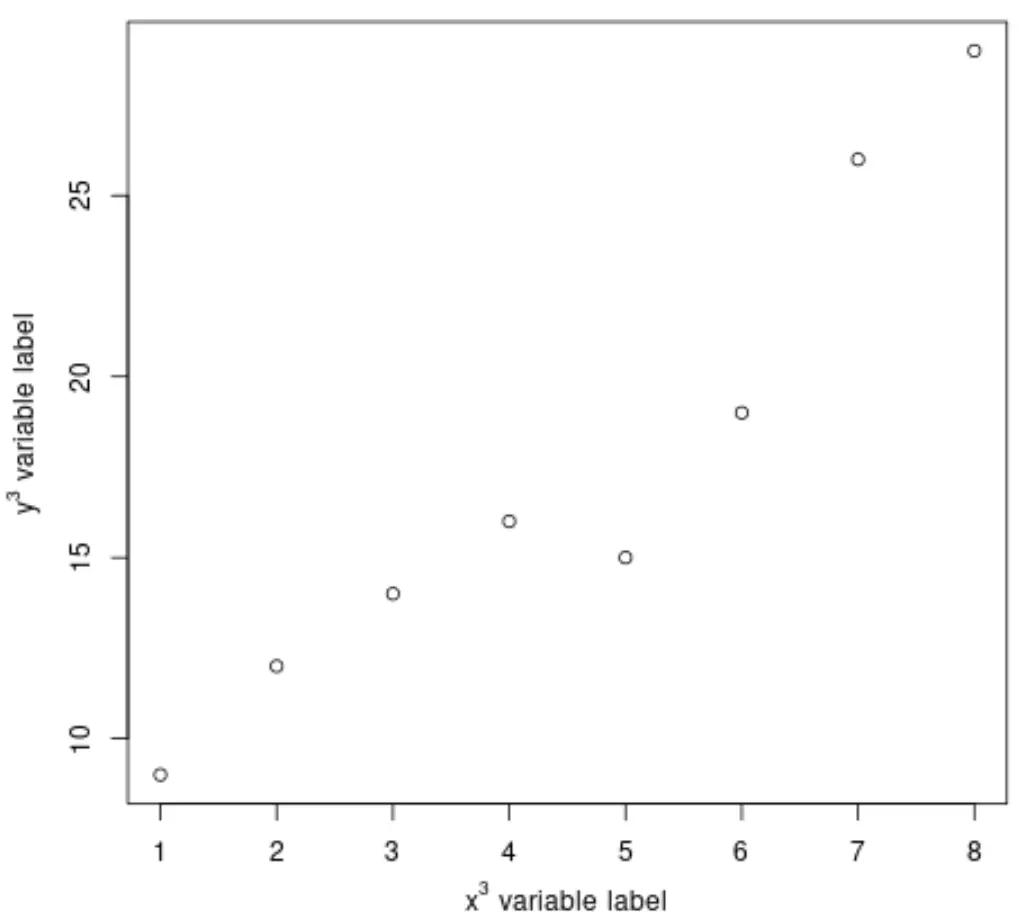
图中 y 轴指数被截断了一点。为了使标签更接近绘图的轴,我们可以使用 R 中的par()函数:
 #adjust by values (default is (3, 0, 0))
by(mgp=c(2.5, 1, 0))

#createplot
plot(x, y, xlab = x_expression, ylab = y_expression)

注意:我们选择“3”作为随机值作为指数。随意放置任何数值或字符作为上标。
示例 2:向轴标签添加下标
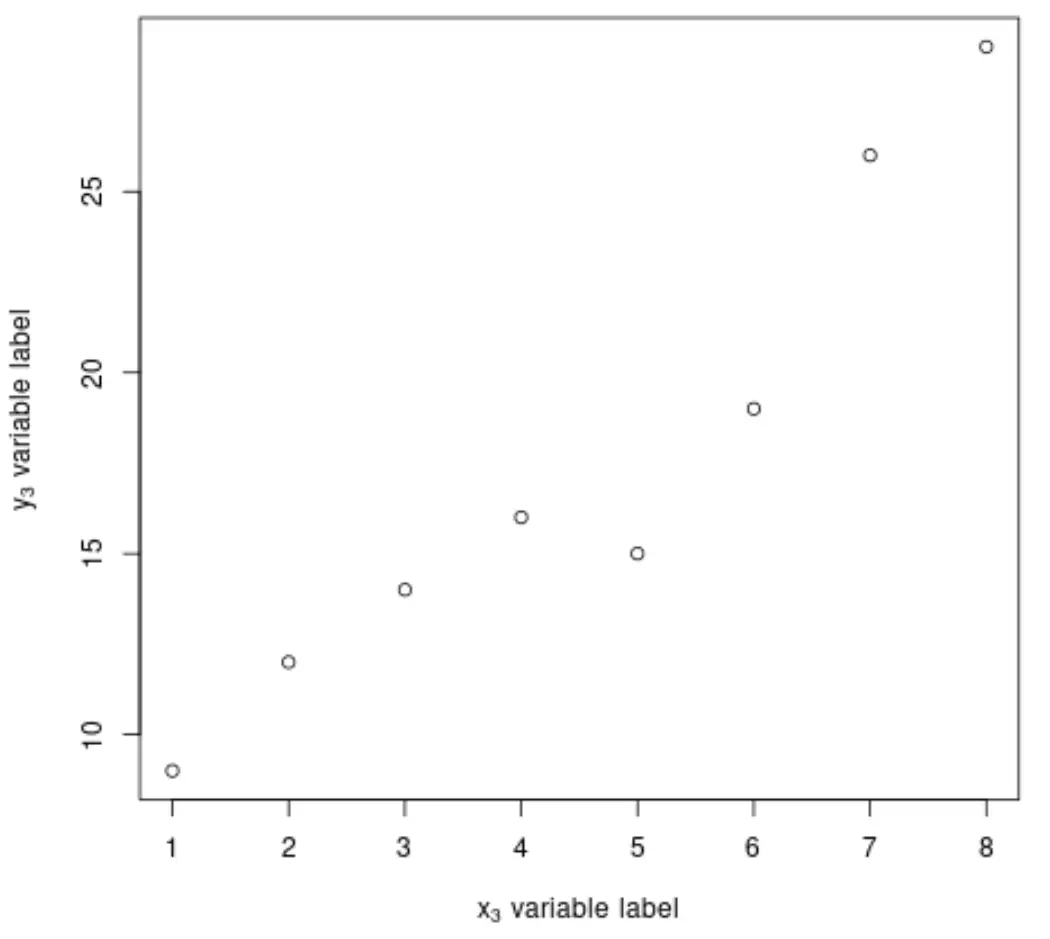
以下代码显示了如何向 R 中绘图的轴标签添加索引:
 #define data
x <- c(1, 2, 3, 4, 5, 6, 7, 8)
y <- c(9, 12, 14, 16, 15, 19, 26, 29)

#define x and y-axis labels with superscripts
x_expression <- expression(x[3] ~ variable ~ label)
y_expression <- expression(y[3] ~ variable ~ label)

#createplot
plot(x, y, xlab = x_expression, ylab = y_expression)

示例 3:在绘图内添加上标和下标
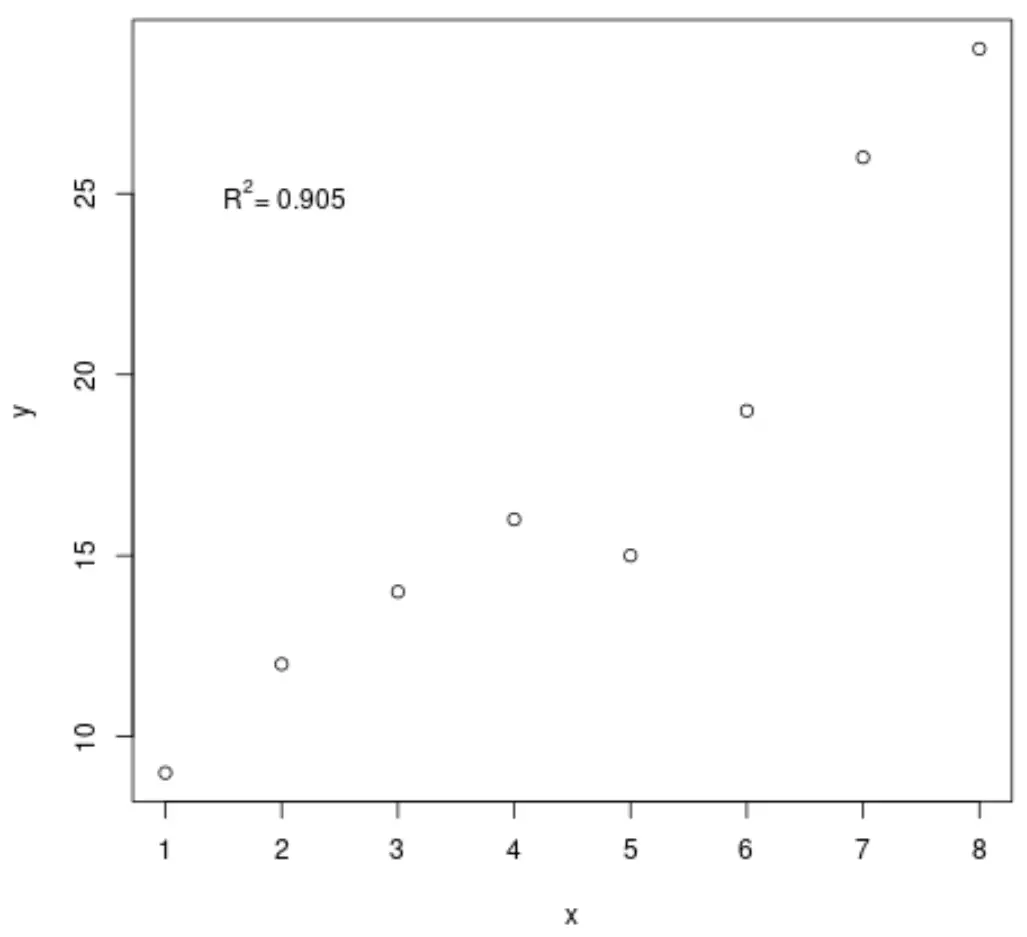
以下代码显示如何向路径内的文本元素添加上标:
 #define data
x <- c(1, 2, 3, 4, 5, 6, 7, 8)
y <- c(9, 12, 14, 16, 15, 19, 26, 29)

#createplot
plot(x, y)

#define label with superscript to add to plot
R2_expression <- expression(paste(" ", R^2 , "= ", .905))

#add text to plot
text(x = 2, y = 25, label = R2_expression)
