
Comment créer une courbe en cloche en Python
Une « courbe en cloche » est le surnom donné à la forme d’unedistribution normale , qui a une forme distincte en « cloche » :
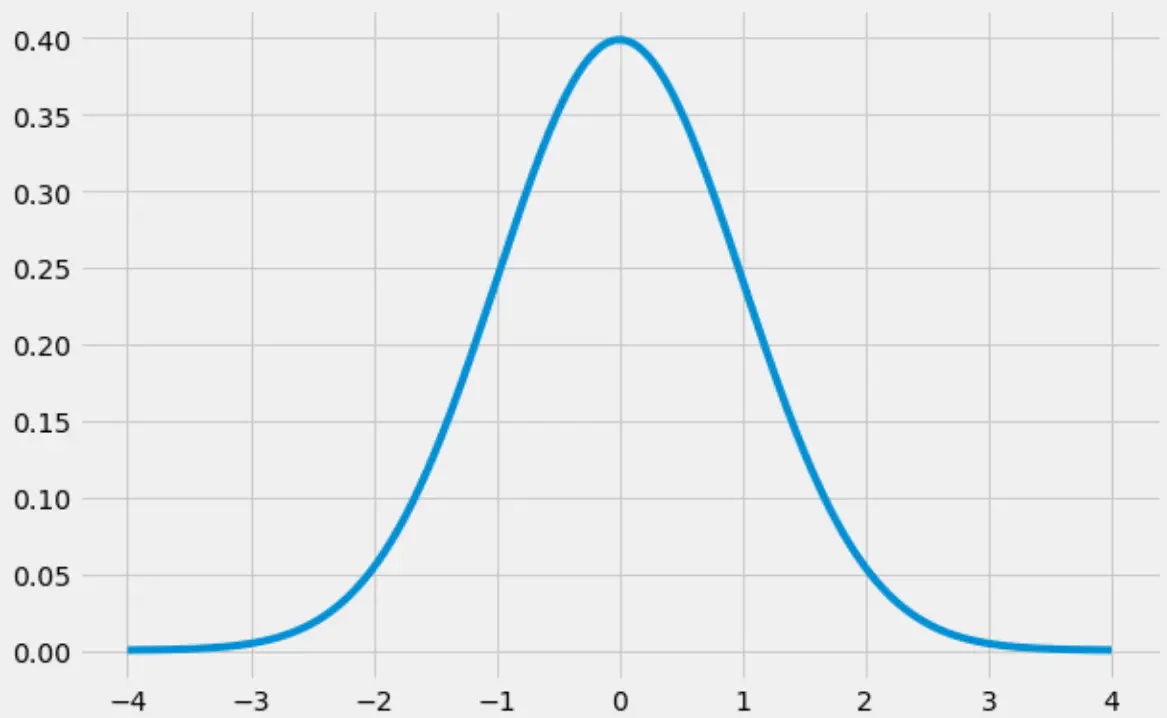
Ce tutoriel explique comment créer une courbe en cloche en Python.
Comment créer une courbe en cloche en Python
Le code suivant montre comment créer une courbe en cloche à l’aide des bibliothèques numpy , scipy et matplotlib :
import numpy as np
import matplotlib.pyplot as plt
from scipy.stats import norm

#create range of x-values from -4 to 4 in increments of .001
x = np.arange(-4, 4, 0.001)

#create range of y-values that correspond to normal pdf with mean=0 and sd=1
y = norm.pdf(x,0,1)

#define plot
fig, ax = plt.subplots(figsize=(9,6))
ax.plot(x,y)

#choose plot style and display the bell curve
plt.style.use('fivethirtyeight')
plt.show()
Comment remplir une courbe en cloche en Python
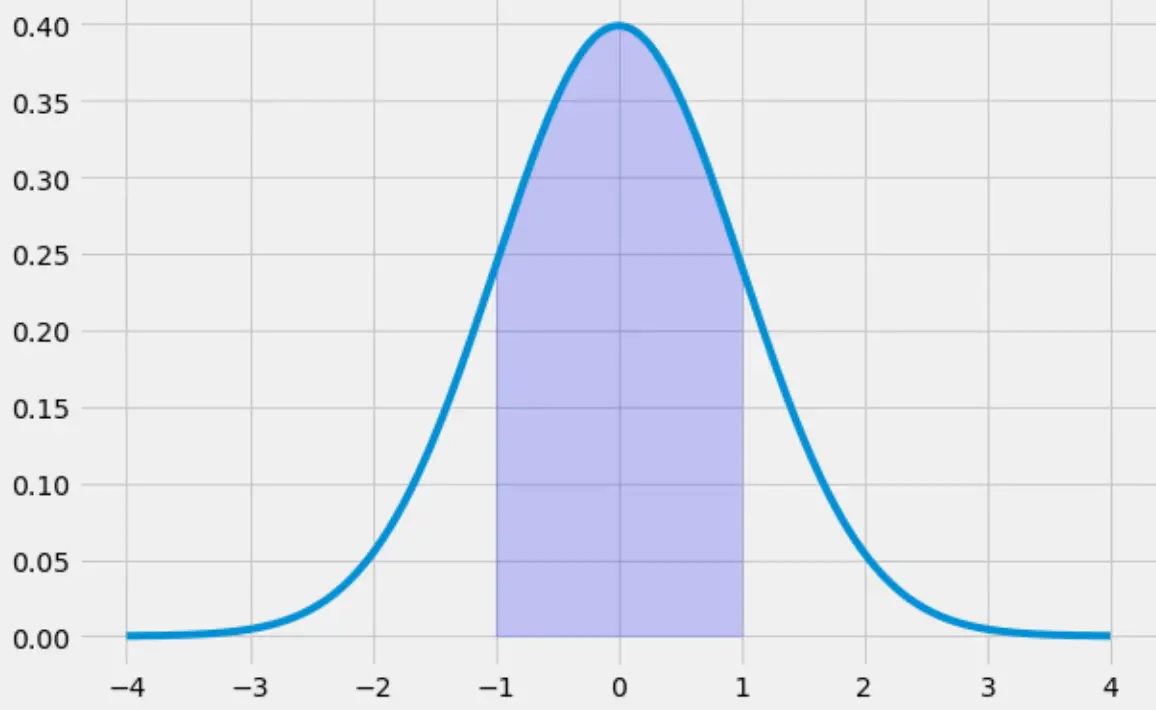
Le code suivant illustre comment remplir la zone sous la courbe en cloche allant de -1 à 1 :
x = np.arange(-4, 4, 0.001)
y = norm.pdf(x,0,1)

fig, ax = plt.subplots(figsize=(9,6))
ax.plot(x,y)

#specify the region of the bell curve to fill in
x_fill = np.arange(-1, 1, 0.001)
y_fill = norm.pdf(x_fill,0,1)
ax.fill_between(x_fill,y_fill,0, alpha=0.2, color='blue')

plt.style.use('fivethirtyeight')
plt.show()
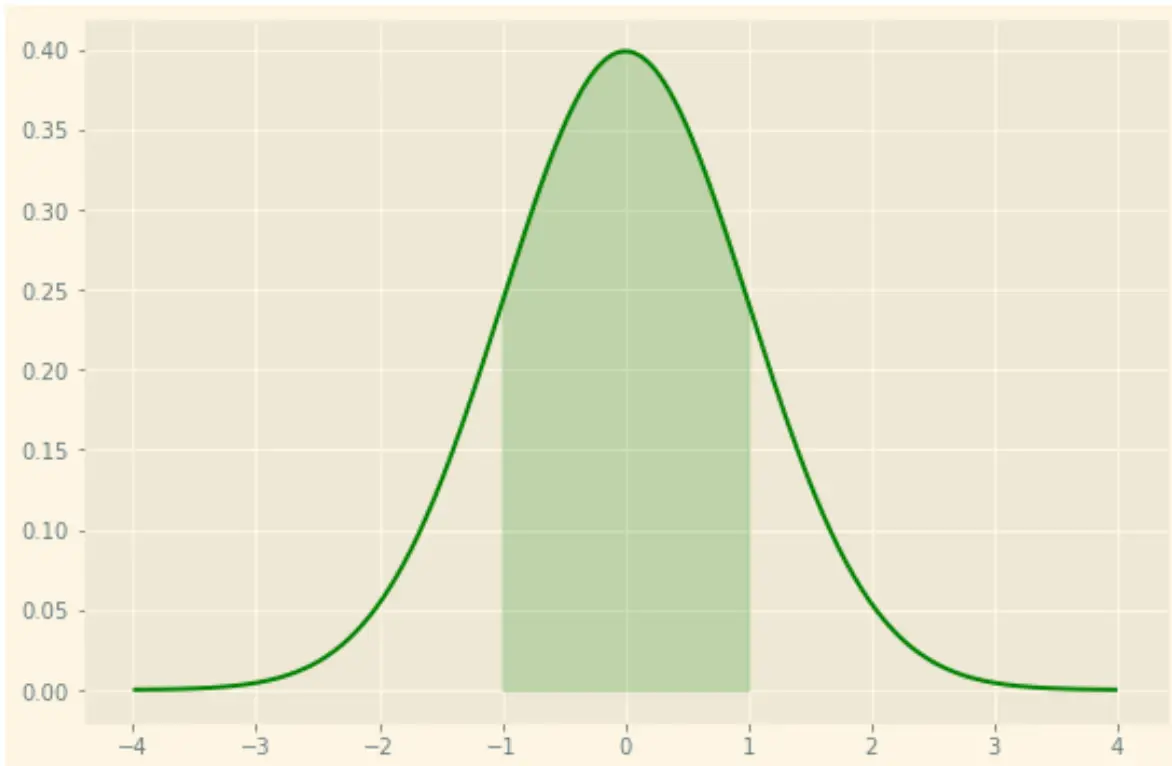
Notez que vous pouvez également styliser le graphique comme vous le souhaitez en utilisant les nombreuses options de style de matplotlib . Par exemple, vous pouvez utiliser un thème « lumière solaire » avec une ligne verte et un ombrage vert :
x = np.arange(-4, 4, 0.001)
y = norm.pdf(x,0,1)

fig, ax = plt.subplots(figsize=(9,6))
ax.plot(x,y, color='green')

#specify the region of the bell curve to fill in
x_fill = np.arange(-1, 1, 0.001)
y_fill = norm.pdf(x_fill,0,1)
ax.fill_between(x_fill,y_fill,0, alpha=0.2, color='green')

plt.style.use('Solarize_Light2')
plt.show()
Vous pouvez trouver le guide complet de référence des feuilles de style pour matplotlib ici .
Ressources additionnelles
à propos de l'auteur
Dr. Benjamin Anderson
Il est un professeur de statistiques à la retraite devenu éducateur dévoué sur Statorials. Avec une vaste expérience et une expertise dans le domaine des statistiques, je m'engage à partager mes connaissances pour responsabiliser les étudiants grâce à Statorials. Lire plus