
Comment ajouter une étiquette à geom_vline dans ggplot2
Vous pouvez utiliser la syntaxe de base suivante pour ajouter une étiquette à une ligne verticale dans ggplot2 :
+ annotate("text", x=9, y=20, label="Here is my text", angle=90)
Les exemples suivants montrent comment utiliser cette syntaxe dans la pratique.
Exemple 1 : ajouter une étiquette à geom_vline
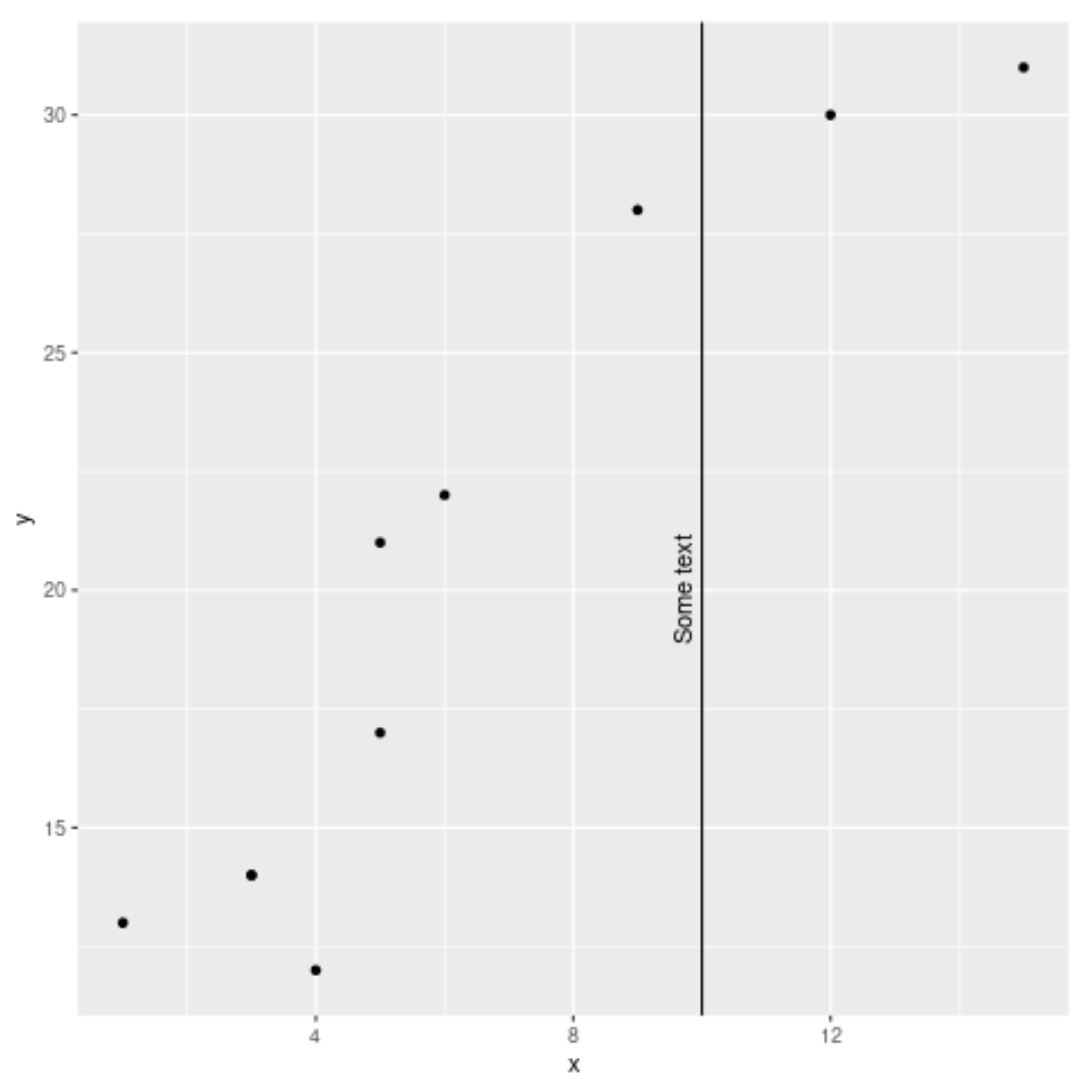
Le code suivant montre comment ajouter une étiquette à une ligne verticale dans ggplot2 :
library(ggplot2)

#create data frame
df <- data.frame(x=c(1, 3, 3, 4, 5, 5, 6, 9, 12, 15),
                 y=c(13, 14, 14, 12, 17, 21, 22, 28, 30, 31))

#create scatterplot with vertical line at x=10
ggplot(df, aes(x=x, y=y)) +
  geom_point() +
  geom_vline(xintercept=10) +
  annotate("text", x=9.7, y=20, label="Some text", angle=90)
Exemple 2 : ajouter une étiquette personnalisée à geom_vline
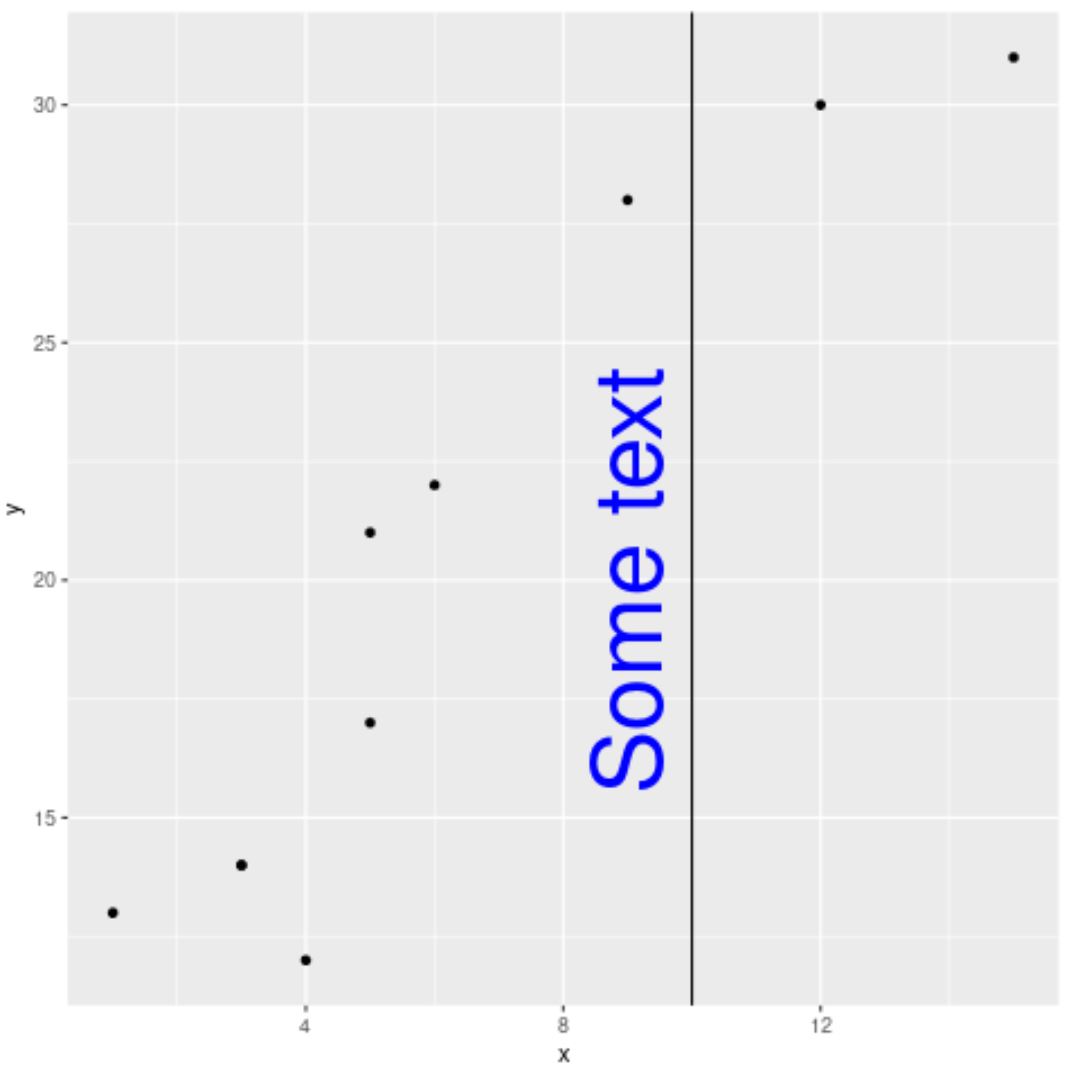
Le code suivant montre comment utiliser les arguments size et color pour ajouter une étiquette avec une taille et une couleur personnalisées à une ligne verticale dans ggplot2 :
library(ggplot2)

#create data frame
df <- data.frame(x=c(1, 3, 3, 4, 5, 5, 6, 9, 12, 15),
                 y=c(13, 14, 14, 12, 17, 21, 22, 28, 30, 31))

#create scatterplot with vertical line at x=10
ggplot(df, aes(x=x, y=y)) +
  geom_point() +
  geom_vline(xintercept=10) +
  annotate("text", x=9, y=20, label="Some text", angle=90, size=15, color="blue")
Exemple 3 : ajouter plusieurs étiquettes à geom_vline
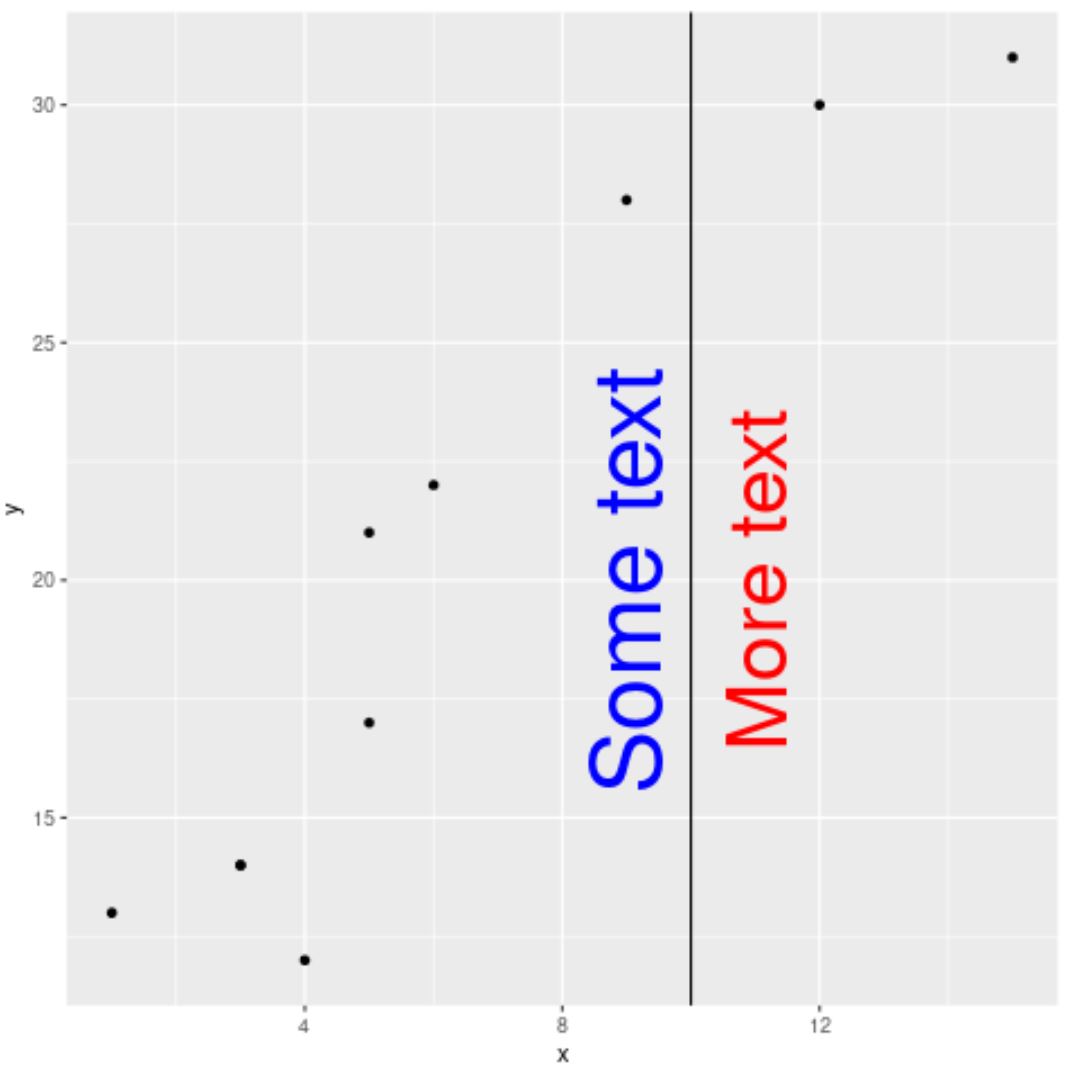
Le code suivant montre comment utiliser la fonction annotate() plusieurs fois pour ajouter plusieurs étiquettes à une ligne verticale dans ggplot2 :
library(ggplot2)

#create data frame
df <- data.frame(x=c(1, 3, 3, 4, 5, 5, 6, 9, 12, 15),
                 y=c(13, 14, 14, 12, 17, 21, 22, 28, 30, 31))

#create scatterplot with vertical line at x=10
ggplot(df, aes(x=x, y=y)) +
  geom_point() +
  geom_vline(xintercept=10) +
  annotate("text", x=9, y=20, label="Some text", angle=90, size=15, color="blue") +
  annotate("text", x=11, y=20, label="More text", angle=90, size=13, color="red")
N’hésitez pas à utiliser la fonction annotate() autant de fois que vous le souhaitez pour ajouter autant d’étiquettes que vous le souhaitez au tracé.
Ressources additionnelles
Les didacticiels suivants expliquent comment effectuer d’autres tâches courantes dans ggplot2 :
Comment tracer une ligne de régression linéaire dans ggplot2
Comment définir les limites de l’axe dans ggplot2
Comment créer des tracés côte à côte dans ggplot2
à propos de l'auteur
Dr. Benjamin Anderson
Il est un professeur de statistiques à la retraite devenu éducateur dévoué sur Statorials. Avec une vaste expérience et une expertise dans le domaine des statistiques, je m'engage à partager mes connaissances pour responsabiliser les étudiants grâce à Statorials. Lire plus