
Comment dessiner des flèches dans Matplotlib
Pour dessiner des flèches dans Matplotlib, vous pouvez utiliser la fonction matplotlib.pyplot.arrow , qui utilise la syntaxe suivante :
matplotlib.pyplot.arrow(x, y, dx, dy)
où:
- x, y : les coordonnées x et y de la base de la flèche
- dx, dy : la longueur de la flèche dans les directions x et y
Ce tutoriel fournit plusieurs exemples d’utilisation pratique de cette fonction.
Exemple 1 : dessiner une seule flèche
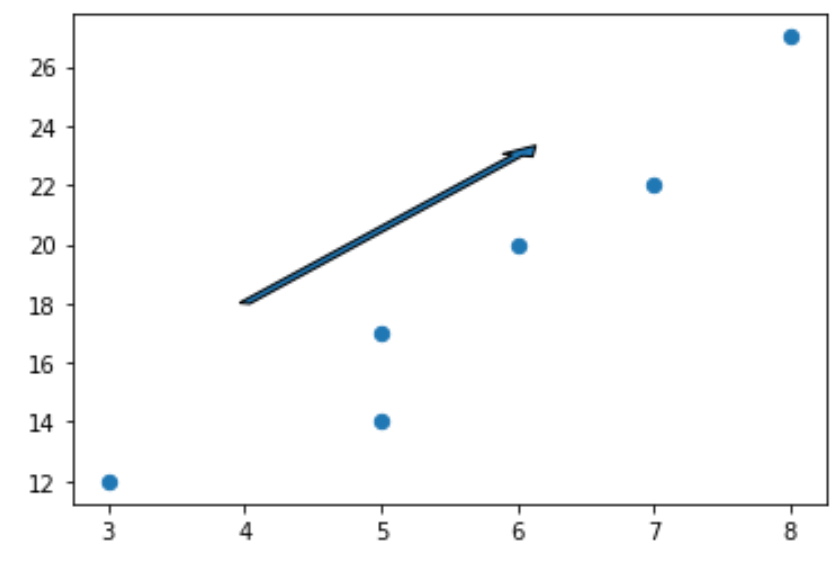
Le code suivant montre comment dessiner une seule flèche sur un tracé Matplotlib :
import matplotlib.pyplot as plt

#define two arrays for plotting
A = [3, 5, 5, 6, 7, 8]
B = [12, 14, 17, 20, 22, 27]

#create scatterplot, specifying marker size to be 40
plt.scatter(A, B, s=40)

#add arrow to plot
plt.arrow(x=4, y=18, dx=2, dy=5, width=.08)

#display plot
plt.show()
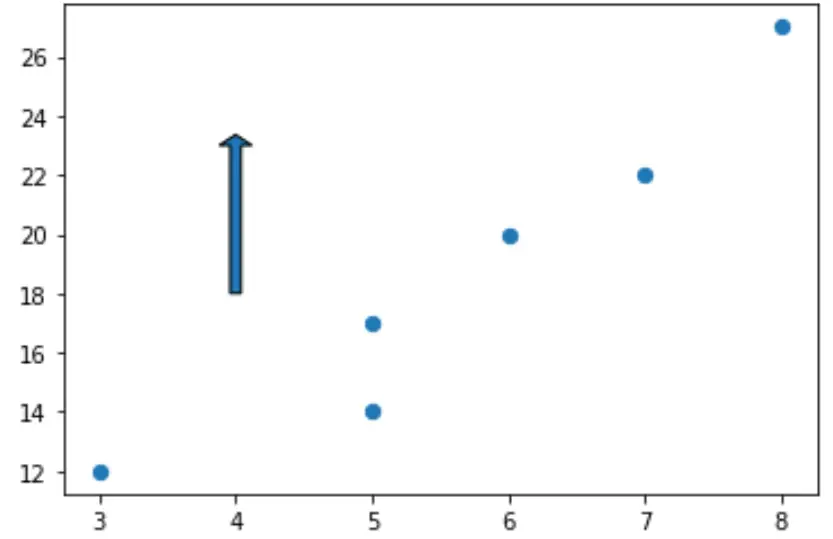
Notez que nous pouvons définir dx=0 pour créer une flèche verticale et dy=0 pour créer une flèche horizontale.
Par exemple, voici comment créer une flèche verticale :
import matplotlib.pyplot as plt

#define two arrays for plotting
A = [3, 5, 5, 6, 7, 8]
B = [12, 14, 17, 20, 22, 27]

#create scatterplot, specifying marker size to be 40
plt.scatter(A, B, s=40)

#add arrow to plot
plt.arrow(x=4, y=18, dx=0, dy=5, width=.08)

#display plot
plt.show()
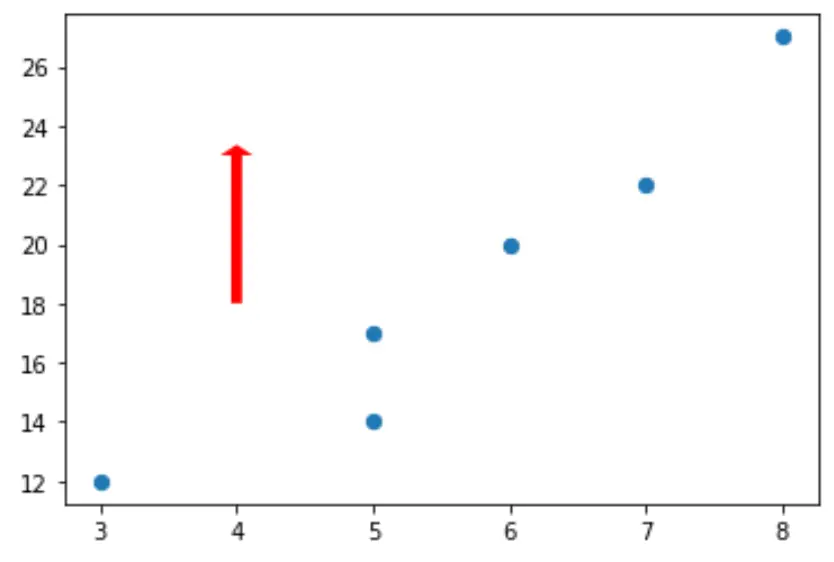
Exemple 2 : styliser une flèche
Par défaut, une flèche dans Matplotlib est bleue avec des bords noirs mais nous pouvons facilement changer cela en utilisant les arguments facecolor et edgecolor :
import matplotlib.pyplot as plt

#define two arrays for plotting
A = [3, 5, 5, 6, 7, 8]
B = [12, 14, 17, 20, 22, 27]

#create scatterplot, specifying marker size to be 40
plt.scatter(A, B, s=40)

#add arrow to plot
plt.arrow(x=4, y=18, dx=0, dy=5, width=.08, facecolor='red', edgecolor='none')

#display plot
plt.show()
Vous pouvez trouver une liste complète des propriétés de style pouvant être appliquées aux flèches ici .
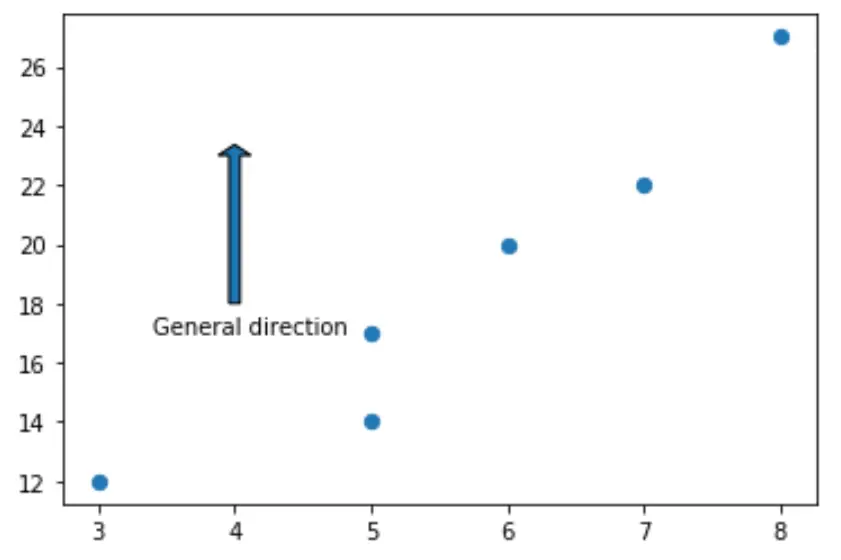
Exemple 3 : ajouter des annotations aux flèches
Le code suivant montre comment ajouter une annotation sous une flèche sur un tracé Matplotlib :
import matplotlib.pyplot as plt

#define two arrays for plotting
A = [3, 5, 5, 6, 7, 8]
B = [12, 14, 17, 20, 22, 27]

#create scatterplot, specifying marker size to be 40
plt.scatter(A, B, s=40)

#add arrow to plot
plt.arrow(x=4, y=18, dx=0, dy=5, width=.08)

#add annotation
plt.annotate('General direction', xy = (3.4, 17))

#display plot
plt.show()
Ressources additionnelles
Comment tracer des cercles dans Matplotlib (avec exemples)
Comment dessiner des rectangles dans Matplotlib (avec exemples)
à propos de l'auteur
Dr. Benjamin Anderson
Il est un professeur de statistiques à la retraite devenu éducateur dévoué sur Statorials. Avec une vaste expérience et une expertise dans le domaine des statistiques, je m'engage à partager mes connaissances pour responsabiliser les étudiants grâce à Statorials. Lire plus