
Comment créer un histogramme de deux variables dans R
Un histogramme est un moyen utile de visualiser la distribution des valeurs pour une variable donnée.
Pour créer un histogramme pour une variable dans R, vous pouvez utiliser la fonction hist() . Et pour créer un histogramme pour deux variables dans R, vous pouvez utiliser la syntaxe suivante :
hist(variable1, col='red')
hist(variable2, col='blue', add=TRUE)
L’exemple suivant montre comment utiliser cette syntaxe dans la pratique.
Exemple : créer un histogramme de deux variables dans R
Le code suivant montre comment créer un histogramme de deux variables dans R :
#make this example reproducible
set.seed(1)

#define data
x1 = rnorm(1000, mean=0.6, sd=0.1)
x2 = rnorm(1000, mean=0.4, sd=0.1)

#plot two histograms in same graph
hist(x1, col='red')
hist(x2, col='blue', add=TRUE)
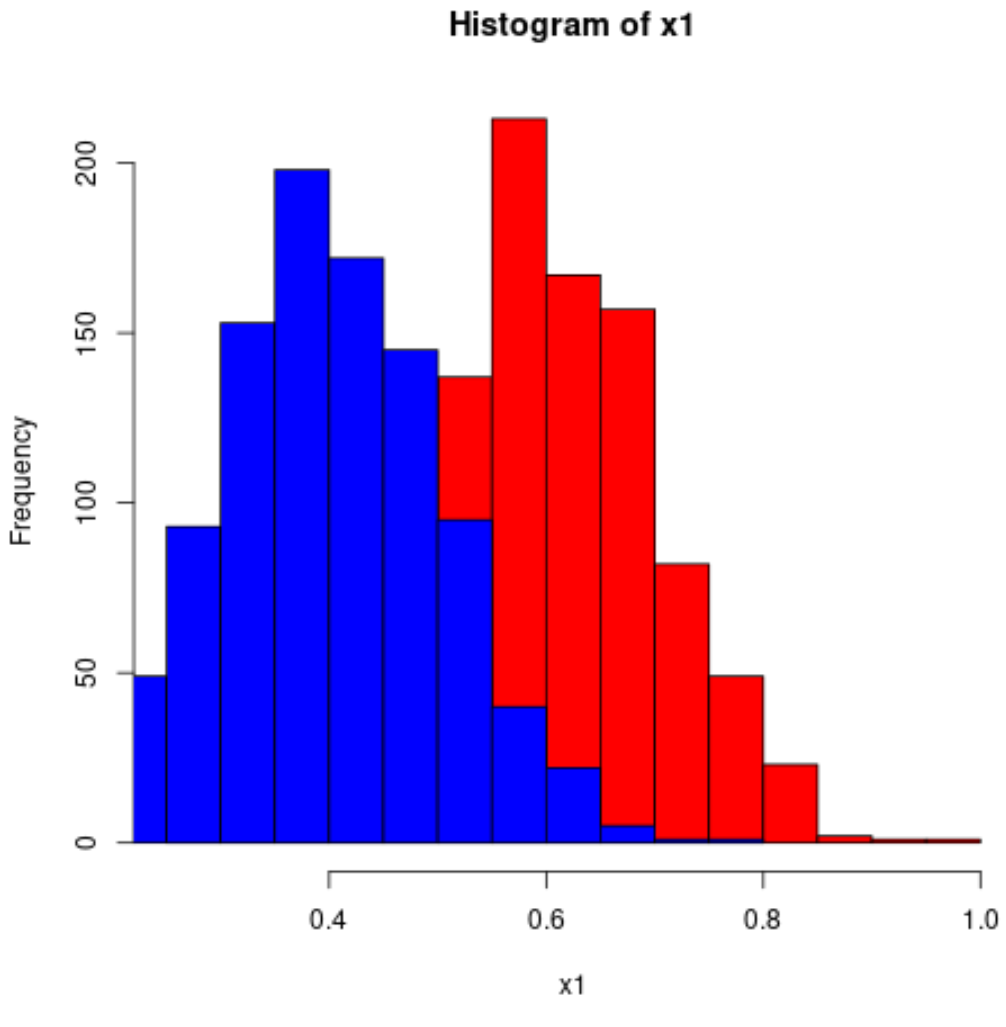
Puisque les valeurs des histogrammes se chevauchent, c’est une bonne idée d’utiliser des couleurs rgb() avec une transparence accrue :
#make this example reproducible
set.seed(1)

#define data
x1 = rnorm(1000, mean=0.6, sd=0.1)
x2 = rnorm(1000, mean=0.4, sd=0.1)

#plot two histograms in same graph
hist(x1, col=rgb(0,0,1,0.2), xlim=c(0, 1),
     xlab='Values', ylab='Frequency', main='Histogram for two variables')
hist(x2, col=rgb(1,0,0,0.2), add=TRUE)
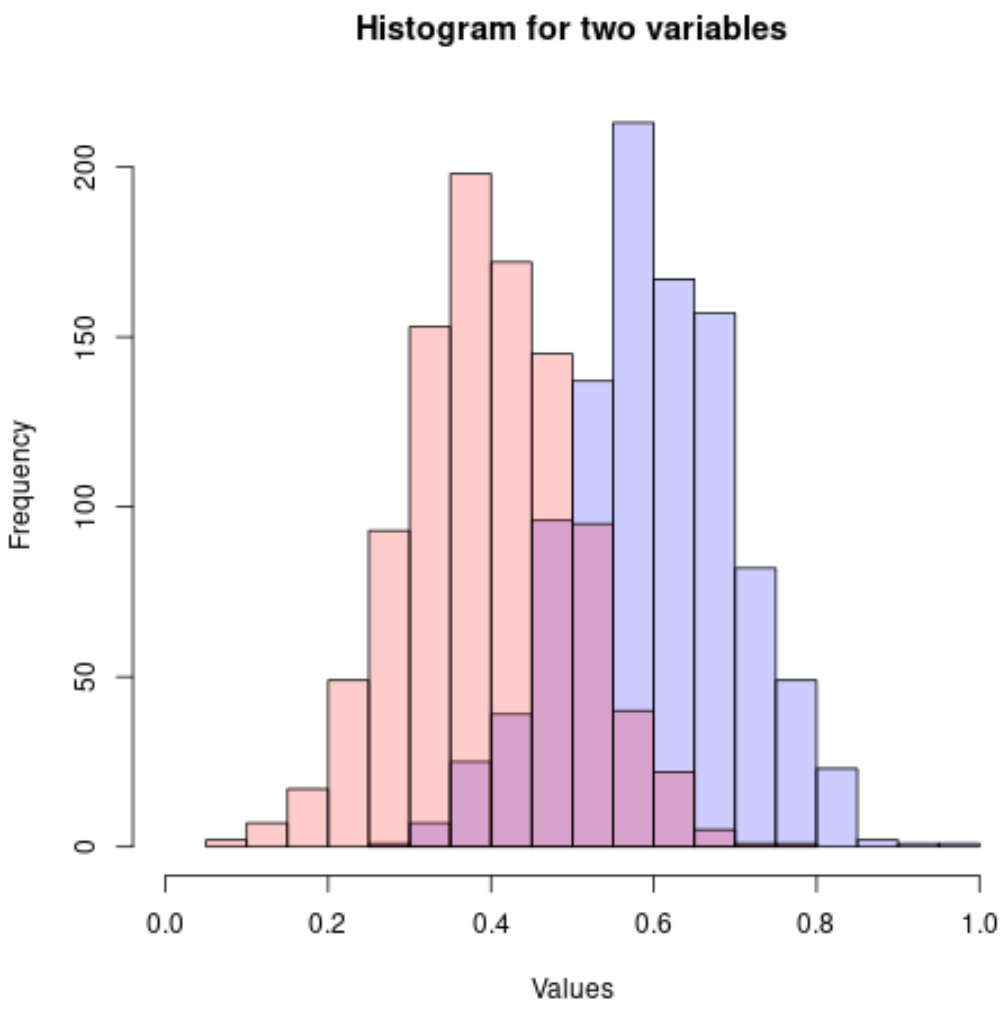
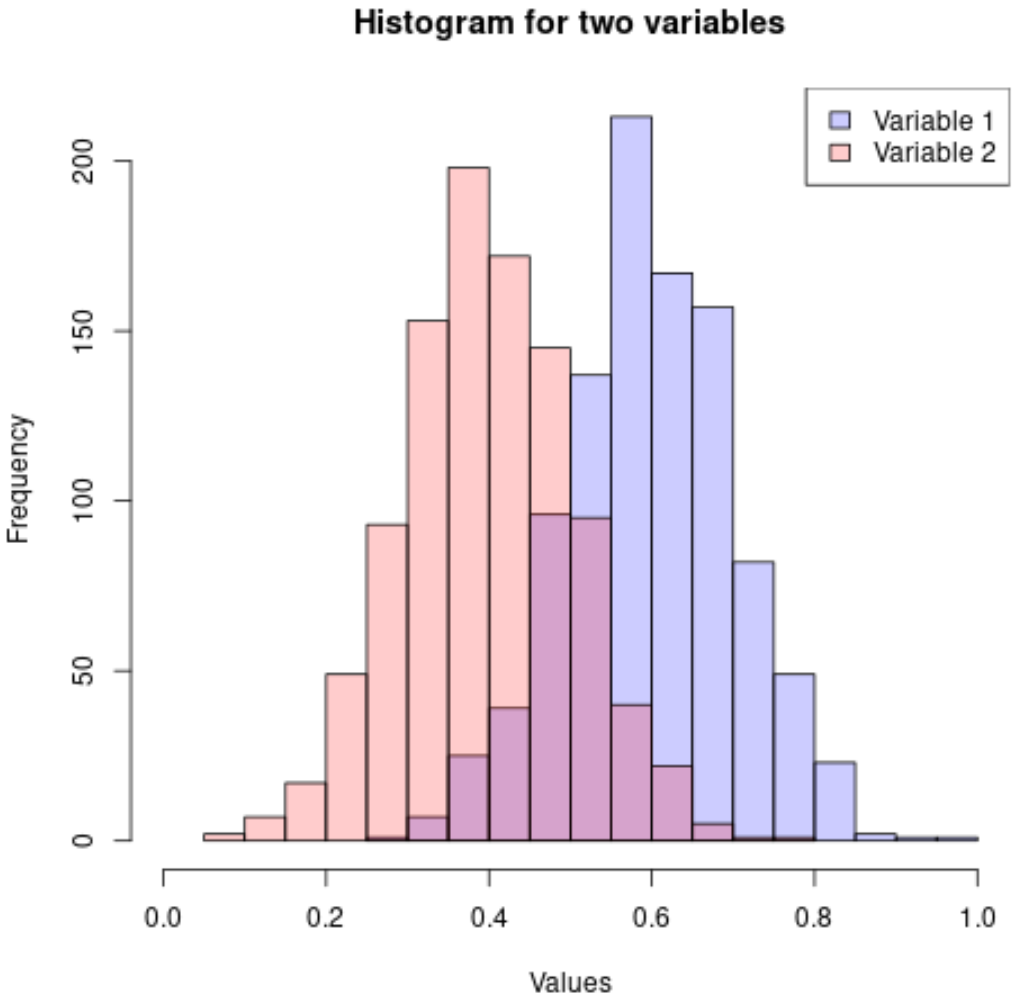
Vous pouvez également ajouter une légende pour faciliter l’interprétation des histogrammes :
#make this example reproducible
set.seed(1)

#define data
x1 = rnorm(1000, mean=0.6, sd=0.1)
x2 = rnorm(1000, mean=0.4, sd=0.1)

#plot two histograms in same graph
hist(x1, col=rgb(0,0,1,0.2), xlim=c(0, 1),
     xlab='Values', ylab='Frequency', main='Histogram for two variables')
hist(x2, col=rgb(1,0,0,0.2), add=TRUE)

#add legend
legend('topright', c('Variable 1', 'Variable 2'),
       fill=c(rgb(0,0,1,0.2), rgb(1,0,0,0.2)))
Vous pouvez trouver plus de didacticiels R sur cette page .
à propos de l'auteur
Dr. Benjamin Anderson
Il est un professeur de statistiques à la retraite devenu éducateur dévoué sur Statorials. Avec une vaste expérience et une expertise dans le domaine des statistiques, je m'engage à partager mes connaissances pour responsabiliser les étudiants grâce à Statorials. Lire plus