R에서 수정하는 방법:plot.new가 아직 호출되지 않았습니다.
R을 사용할 때 발생할 수 있는 오류는 다음과 같습니다.
 Error in plot.xy(xy.coords(x, y), type = type, ...):
  plot.new has not been called yet
이 오류는 R에 플롯이 이미 존재해야 하는 작업을 수행하려고 시도했지만 플롯이 존재하지 않을 때 발생합니다.
다음 예에서는 실제로 이 오류를 수정하는 방법을 보여줍니다.
예제 1: line()으로 오류를 수정하는 방법
R에서 적합 회귀선을 그리려고 한다고 가정해 보겠습니다.
 #createdata
df <- data. frame (x=c(1, 2, 2, 3, 5, 6, 8, 8, 9, 9, 10, 11, 12, 15, 15),
                 y=c(2, 3, 3, 4, 5, 5, 6, 7, 8, 8, 9, 10, 16, 19, 28))

#fit polynomial regression model
model <- lm(y~poly(x, 2), data=df)

#define new sequence of x-values
new_x <- seq(min(df$x), max(df$y))

#attempt to plot fitted regression line
lines(new_x, predict(model, newdata = data. frame (x=new_x)))

Error in plot.xy(xy.coords(x, y), type = type, ...):
  plot.new has not been called yet
R에서 먼저 경로를 생성하지 않고는 line() 함수를 사용할 수 없기 때문에 오류가 발생합니다.
이 오류를 수정하려면 먼저 산점도를 만든 다음 line() 함수를 사용하면 됩니다.
 #create data
df <- data. frame (x=c(1, 2, 2, 3, 5, 6, 8, 8, 9, 9, 10, 11, 12, 15, 15),
                 y=c(2, 3, 3, 4, 5, 5, 6, 7, 8, 8, 9, 10, 16, 19, 28))

#fit polynomial regression model
model <- lm(y~poly(x, 2), data=df)

#define new sequence of x-values
new_x <- seq(min(df$x), max(df$y))

#create scatterplot of x vs. y values
plot(y~x, data=df)

#attempt to plot fitted regression line
lines(new_x, predict(model, newdata = data. frame (x=new_x)))
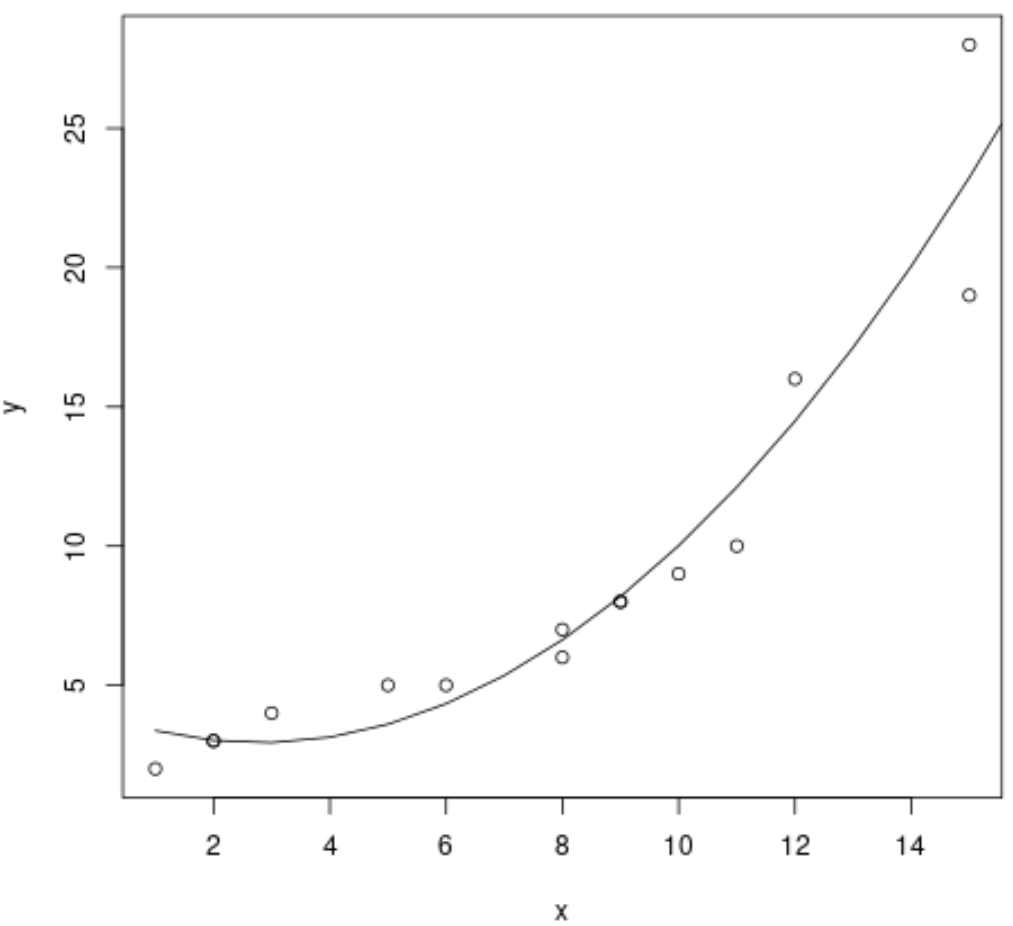
line() 함수를 사용하기 전에 먼저 plot() 함수를 사용했기 때문에 오류가 발생하지 않습니다.
예제 2: abline()을 사용하여 오류를 수정하는 방법
R에서 직선 수평선으로 산점도를 생성하려고 한다고 가정합니다.
 #create data
df <- data. frame (x=c(1, 2, 2, 3, 5, 6, 8, 8, 9, 9, 10, 11, 12, 15, 15),
                 y=c(2, 3, 3, 4, 5, 5, 6, 7, 8, 8, 9, 10, 16, 19, 28))

#attempt to add horizontal line at y=10
abline(a=10, b=0, lwd=2)

Error in plot.xy(xy.coords(x, y), type = type, ...):
  plot.new has not been called yet
R에서 먼저 플롯을 생성하지 않고는 abline() 함수를 사용할 수 없기 때문에 오류가 발생합니다.
이 오류를 수정하려면 먼저 산점도를 만든 다음 abline() 함수를 사용할 수 있습니다.
 #createdata
df <- data. frame (x=c(1, 2, 2, 3, 5, 6, 8, 8, 9, 9, 10, 11, 12, 15, 15),
                 y=c(2, 3, 3, 4, 5, 5, 6, 7, 8, 8, 9, 10, 16, 19, 28))

#create scatterplot of x vs. y
plot(y~x, data=df)

#add horizontal line at y=10
abline(a=10, b=0, lwd=2)
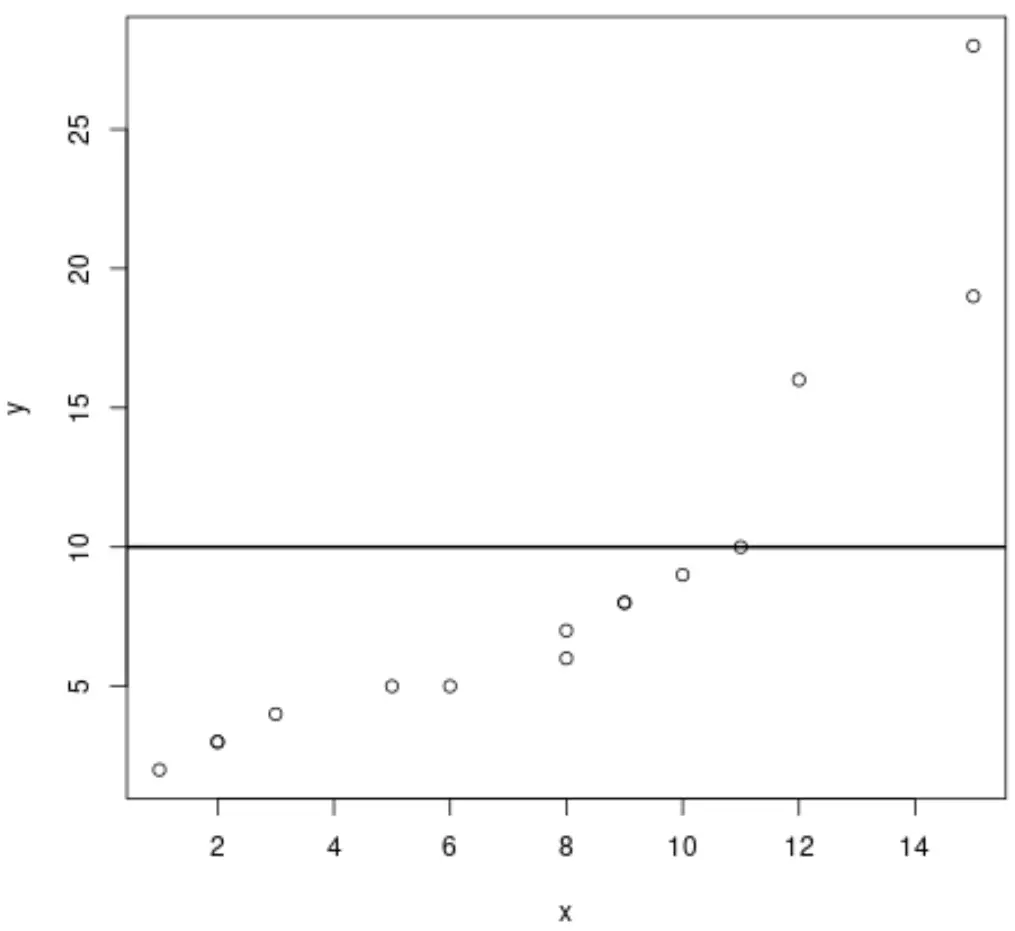
abline() 함수를 사용하기 전에 먼저 plot() 함수를 사용했기 때문에 오류가 발생하지 않습니다.
관련 항목: R에서 aline()을 사용하여 경로에 직선을 추가하는 방법
추가 리소스
다음 튜토리얼에서는 R의 다른 일반적인 오류를 수정하는 방법을 설명합니다.
R에서 수정하는 방법: 예상치 못한 문자열 상수
R 수정 방법: ExtractVars의 잘못된 템플릿 수식
R에서 수정하는 방법: 인수가 숫자도 아니고 논리도 아닙니다. return na
저자 소개
벤자민 앤더슨
안녕하세요. 저는 통계학 교수를 퇴직하고 전임 통계 교사로 변신한 벤자민입니다. 통계 분야의 광범위한 경험과 전문 지식을 바탕으로 Statorials를 통해 학생들에게 힘을 실어주기 위해 지식을 공유하고 싶습니다. 더 알아보기