
Comment dessiner une ligne verticale dans Matplotlib (avec exemples)
Vous pouvez utiliser la syntaxe suivante pour tracer une ligne verticale dans Matplotlib :
import matplotlib.pyplot as plt

#draw vertical line at x=2
plt.axvline(x=2)
Les exemples suivants montrent comment utiliser cette syntaxe en pratique avec le DataFrame pandas suivant :
import pandas as pd

#create DataFrame
df = pd.DataFrame({'x': [1, 2, 3, 4, 5, 6, 7, 8],
                   'y': [5, 7, 8, 15, 26, 39, 45, 40]})

#view DataFrame
df

	x	y
0	1	5
1	2	7
2	3	8
3	4	15
4	5	26
5	6	39
6	7	45
7	8	40
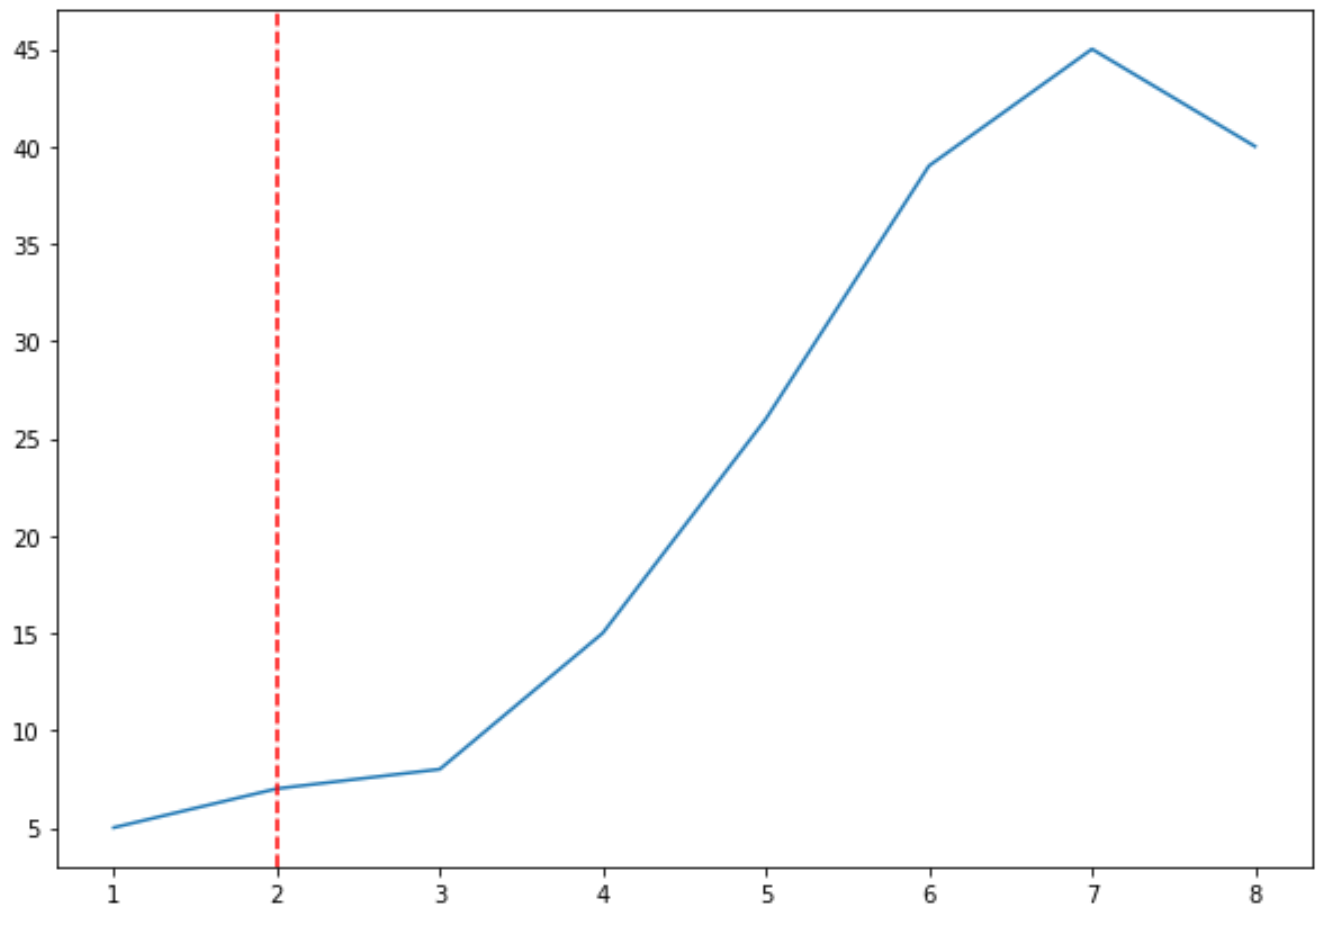
Exemple 1 : tracer une ligne verticale
Le code suivant montre comment tracer une ligne verticale sur un tracé Matplotlib :
import matplotlib.pyplot as plt

#create line plot
plt.plot(df.x, df.y)

#add vertical line at x=2
plt.axvline(x=2, color='red', linestyle='--')
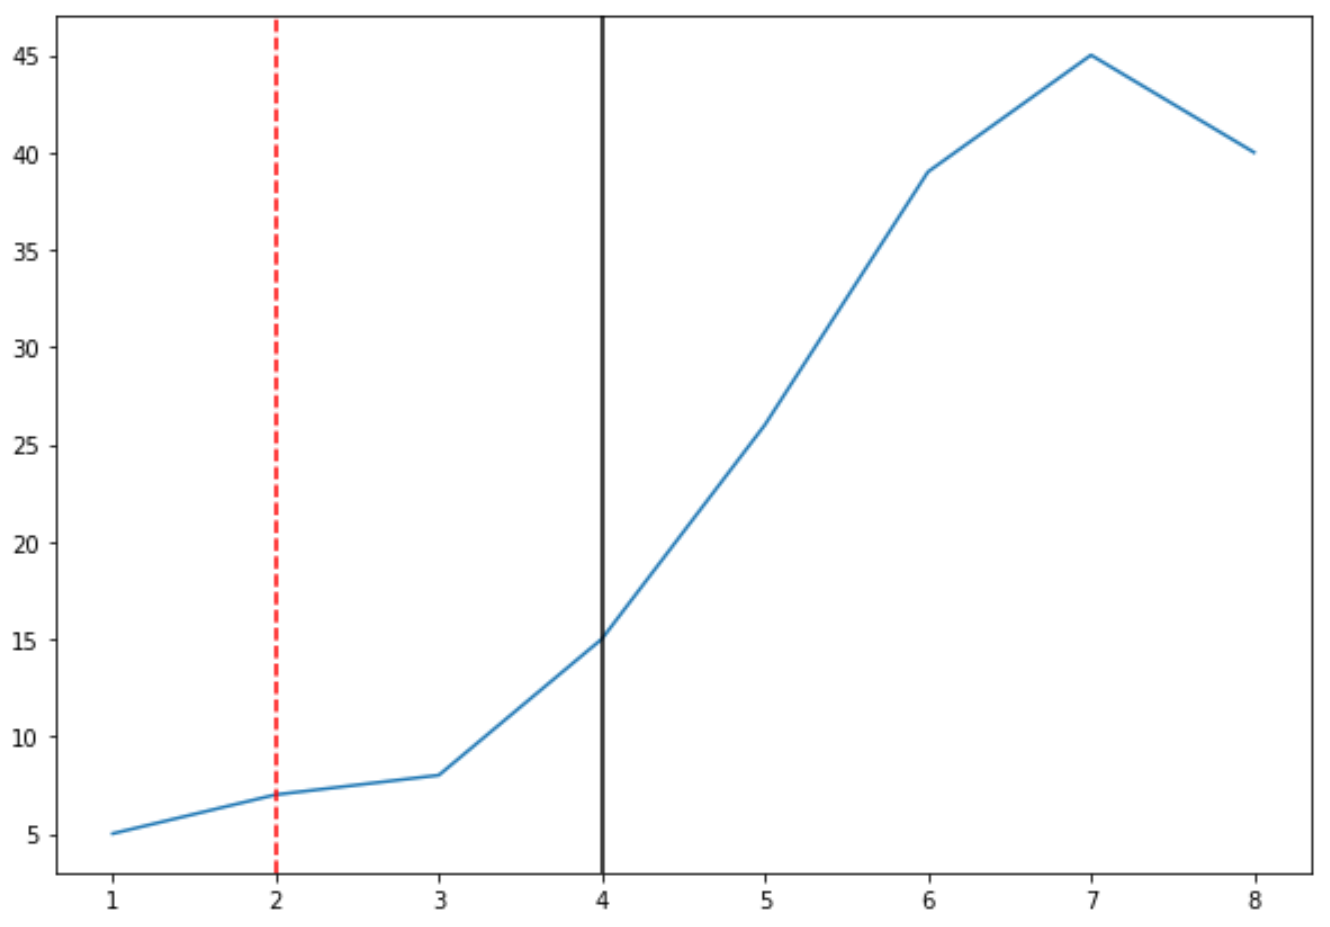
Exemple 2 : tracer plusieurs lignes verticales
Le code suivant montre comment dessiner plusieurs lignes verticales sur un tracé Matplotlib :
import matplotlib.pyplot as plt

#create line plot
plt.plot(df.x, df.y)

#add vertical line at x=2
plt.axvline(x=2, color='red', linestyle='--')

#add vertical line at x=4
plt.axvline(x=4, color='black', linestyle='-')
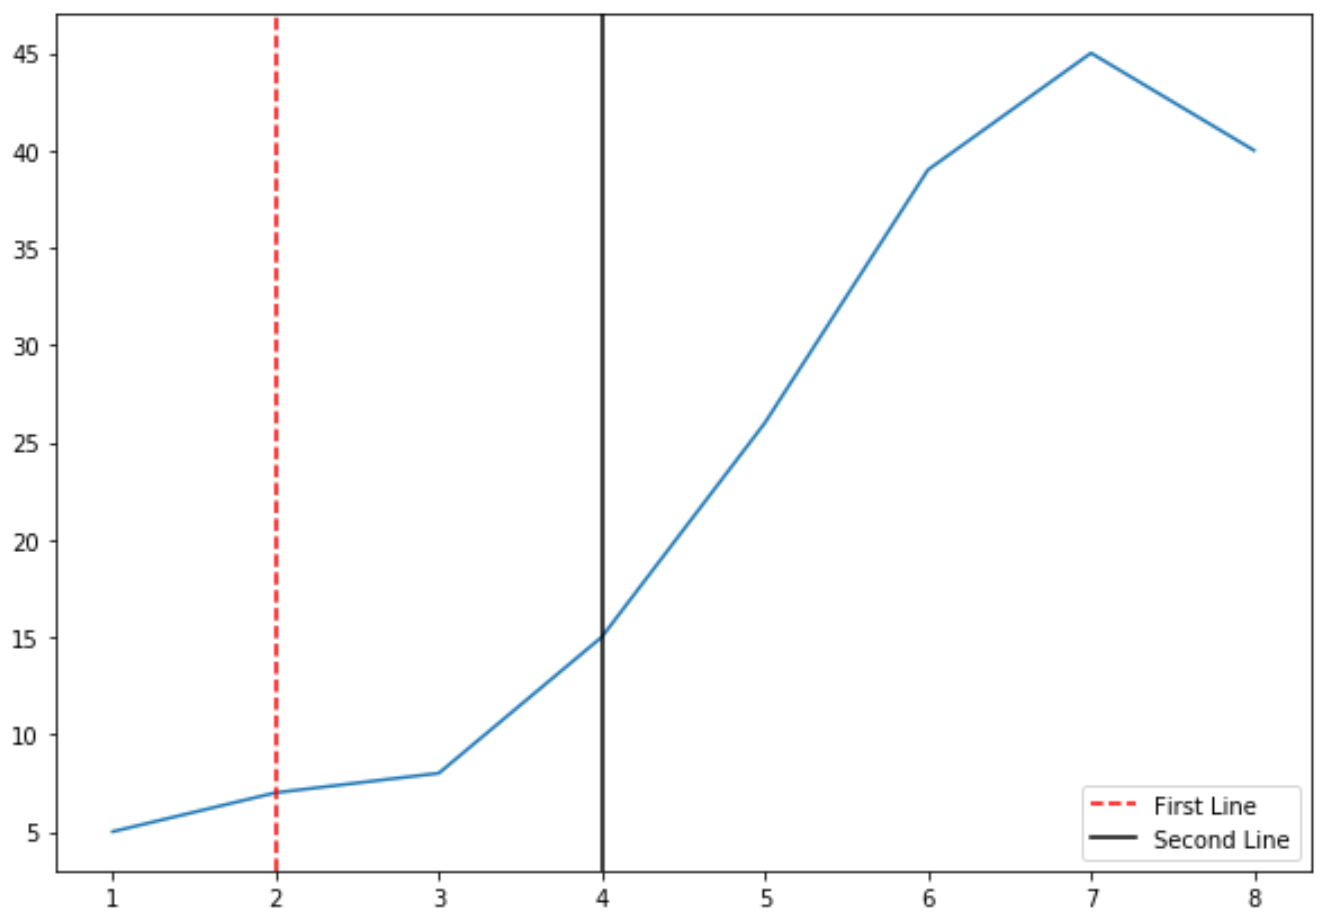
Exemple 3 : tracer plusieurs lignes verticales avec une légende
Le code suivant montre comment dessiner plusieurs lignes verticales sur un tracé Matplotlib et ajouter une légende pour faciliter l’interprétation des lignes :
import matplotlib.pyplot as plt

#create line plot
plt.plot(df.x, df.y)

#add vertical line at x=2
plt.axvline(x=2, color='red', linestyle='--', label='First Line')

#add vertical line at x=4
plt.axvline(x=4, color='black', linestyle='-', label='Second Line')

#add legend
plt.legend()
Remarque : reportez-vous à la documentation Matplotlib pour obtenir une liste des couleurs et des styles de ligne potentiels que vous pouvez appliquer aux lignes verticales.
Ressources additionnelles
Comment dessiner une ligne horizontale dans Matplotlib
Comment tracer plusieurs lignes dans Matplotlib
Comment tracer une série chronologique dans Matplotlib
Comment dessiner des rectangles dans Matplotlib
Comment dessiner des flèches dans Matplotlib
à propos de l'auteur
Dr. Benjamin Anderson
Il est un professeur de statistiques à la retraite devenu éducateur dévoué sur Statorials. Avec une vaste expérience et une expertise dans le domaine des statistiques, je m'engage à partager mes connaissances pour responsabiliser les étudiants grâce à Statorials. Lire plus