
Comment obtenir les limites des axes dans Matplotlib (avec exemple)
Vous pouvez utiliser la syntaxe suivante pour obtenir les limites des axes pour les axes x et y d’un tracé dans Matplotlib :
import matplotlib.pyplot as plt

#get x-axis and y-axis limits
xmin, xmax, ymin, ymax = plt.axis()

#print axis limits
print(xmin, xmax, ymin, ymax)
L’exemple suivant montre comment utiliser cette syntaxe dans la pratique.
Exemple : Comment obtenir les limites des axes dans Matplotlib
Supposons que nous créions le nuage de points suivant dans Matplotlib :
import matplotlib.pyplot as plt

#define x and y
x = [1, 2, 3, 4, 5, 6, 7, 8, 9, 10]
y = [1, 5, 9, 15, 24, 39, 35, 35, 40, 41]

#create scatter plot of x vs. y
plt.scatter(x, y)
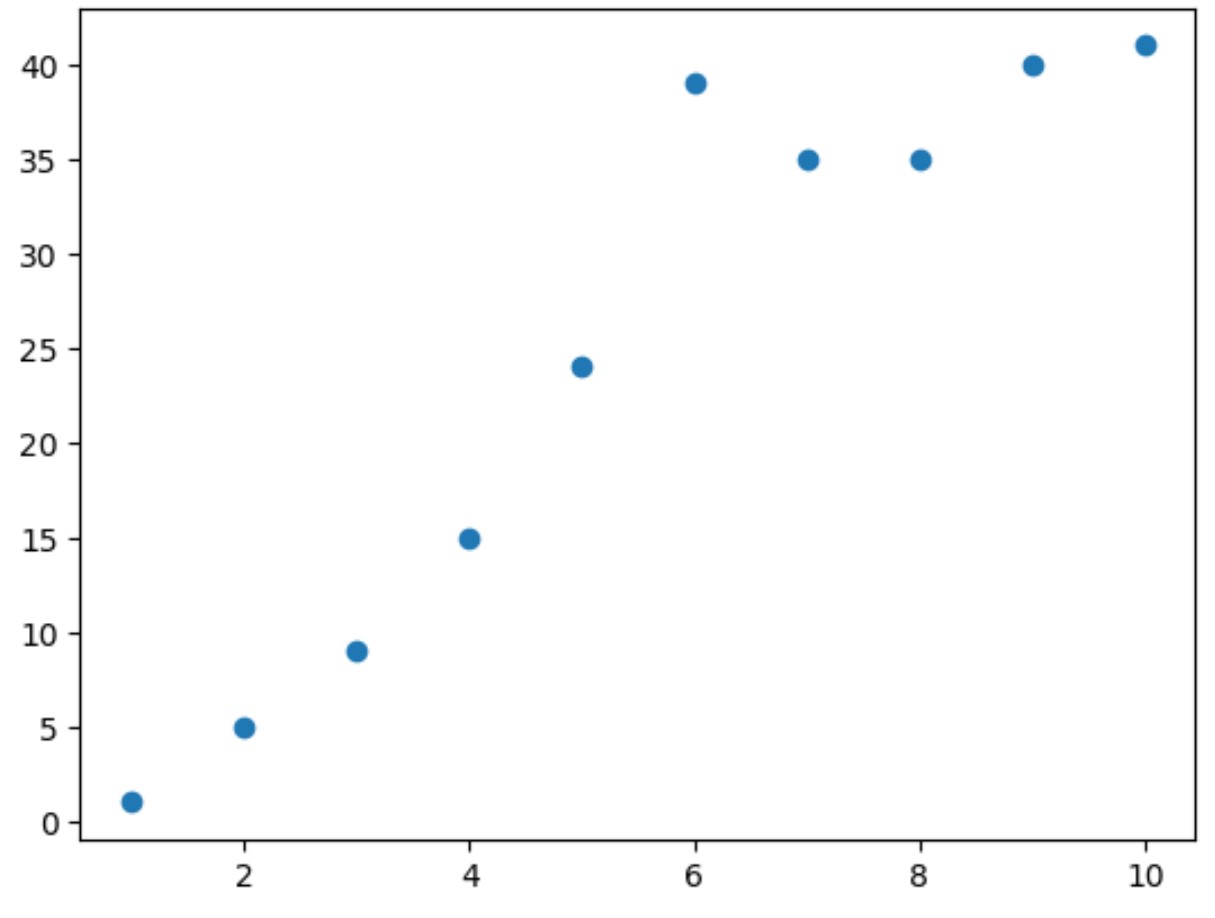
Nous pouvons utiliser la syntaxe suivante pour obtenir les limites des axes pour les axes x et y du nuage de points :
import matplotlib.pyplot as plt

#define x and y
x = [1, 2, 3, 4, 5, 6, 7, 8, 9, 10]
y = [1, 5, 9, 15, 24, 39, 35, 35, 40, 41]

#create scatter plot of x vs. y
plt.scatter(x, y)

#get x-axis and y-axis limits
xmin, xmax, ymin, ymax = plt.axis()

#print axis limits
print(xmin, xmax, ymin, ymax)

0.55 10.45 -1.0 43.0
À partir du résultat, nous pouvons voir :
- Minimum sur l’axe des x : 0,55
- Maximum sur l’axe des x : 10,45
- Minimum sur l’axe y : -1,0
- Maximum sur l’axe y : 43,0
Ces valeurs correspondent aux limites de l’axe visibles dans le nuage de points ci-dessus.
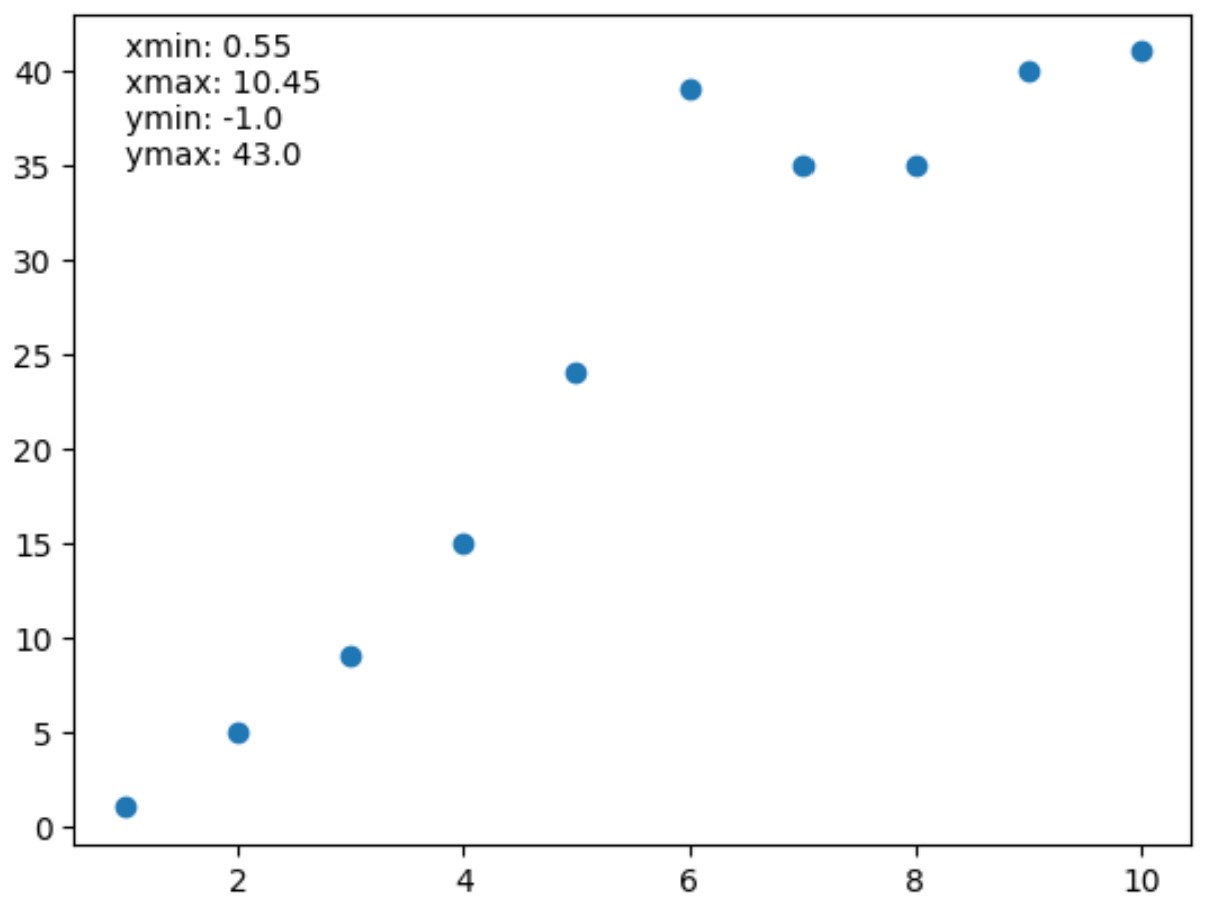
Nous pouvons également utiliser la fonction annotate() pour ajouter ces limites d’axe en tant que valeurs de texte au tracé si nous le souhaitons :
import matplotlib.pyplot as plt

#define x and y
x = [1, 2, 3, 4, 5, 6, 7, 8, 9, 10]
y = [1, 5, 9, 15, 24, 39, 35, 35, 40, 41]

#create scatter plot of x vs. y
plt.scatter(x, y)

#get x-axis and y-axis limits
xmin, xmax, ymin, ymax = plt.axis()

#print axis limits
lims = 'xmin: ' + str(round(xmin, 2)) + '\n' + \
       'xmax: ' + str(round(xmax, 2)) + '\n' + \
       'ymin: ' + str(round(ymin, 2)) + '\n' + \
       'ymax: ' + str(round(ymax, 2))

#add axis limits to plot at (x,y) coordinate (1,35)
plt.annotate(lims, (1, 35))
Ressources additionnelles
Les didacticiels suivants expliquent comment effectuer d’autres tâches courantes dans Matplotlib :
Comment définir les graduations d’axe dans Matplotlib
Comment augmenter la taille du tracé dans Matplotlib
Comment ajouter du texte aux tracés Matplotlib
à propos de l'auteur
Dr. Benjamin Anderson
Il est un professeur de statistiques à la retraite devenu éducateur dévoué sur Statorials. Avec une vaste expérience et une expertise dans le domaine des statistiques, je m'engage à partager mes connaissances pour responsabiliser les étudiants grâce à Statorials. Lire plus