
Comment tracer uniquement un quadrillage horizontal dans Matplotlib
Vous pouvez utiliser la syntaxe de base suivante pour tracer uniquement un quadrillage horizontal dans Matplotlib :
ax.grid(axis='y')
L’exemple suivant montre comment utiliser cette syntaxe dans la pratique.
Exemple : tracer uniquement un quadrillage horizontal dans Matplotlib
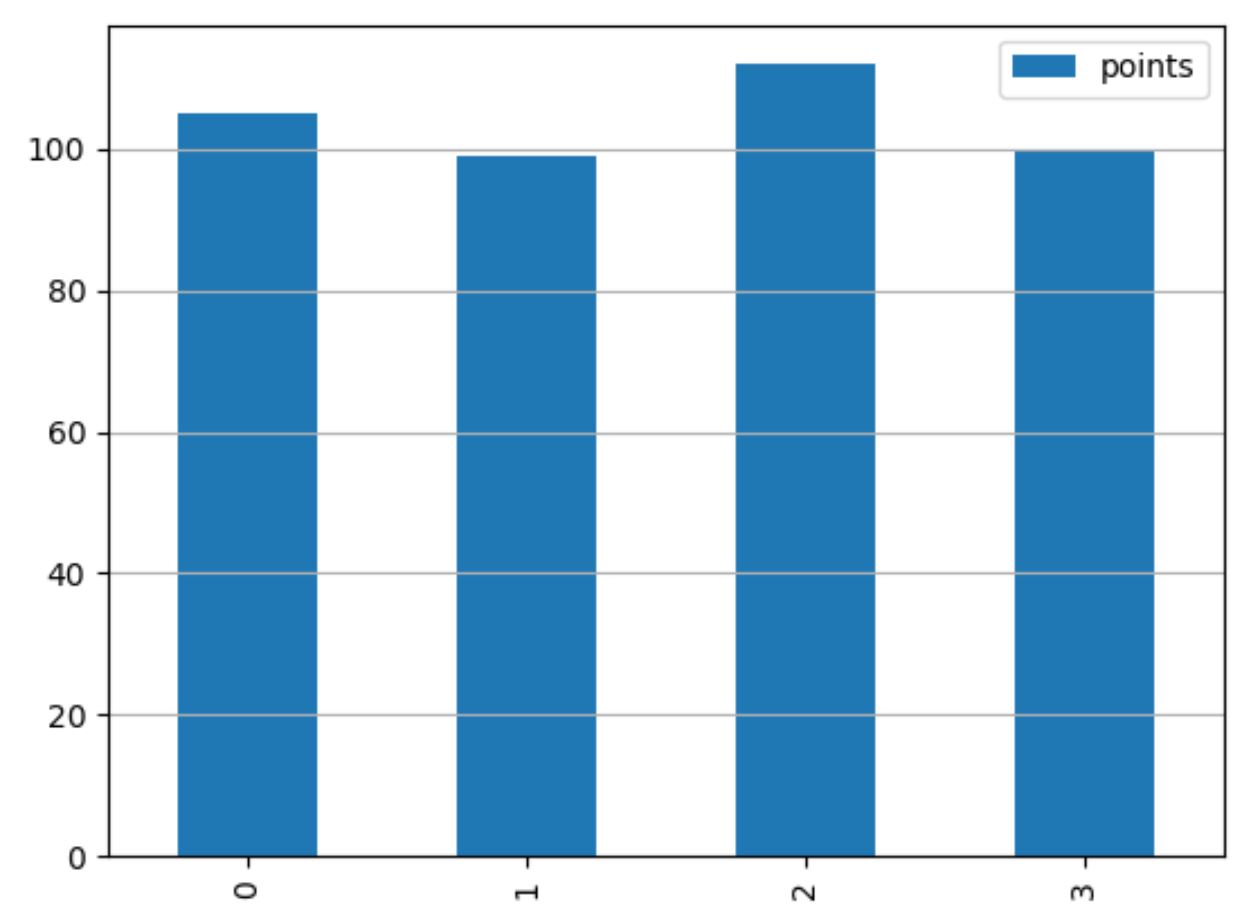
Le code suivant montre comment créer un tracé à barres dans Matplotlib avec uniquement un quadrillage horizontal affiché dans le tracé :
import pandas as pd
import matplotlib.pyplot as plt

#create DataFrame
df = pd.DataFrame({'team':['Mavs', 'Nets', 'Spurs', 'Warriors'],
                   'points':[105, 99, 112, 100]})

#define plot
fig, ax = plt.subplots()

#create bar plot
df.plot(kind='bar', ax=ax)

#add horizontal gridlines
ax.grid(axis='y')

#display plot
plt.show()
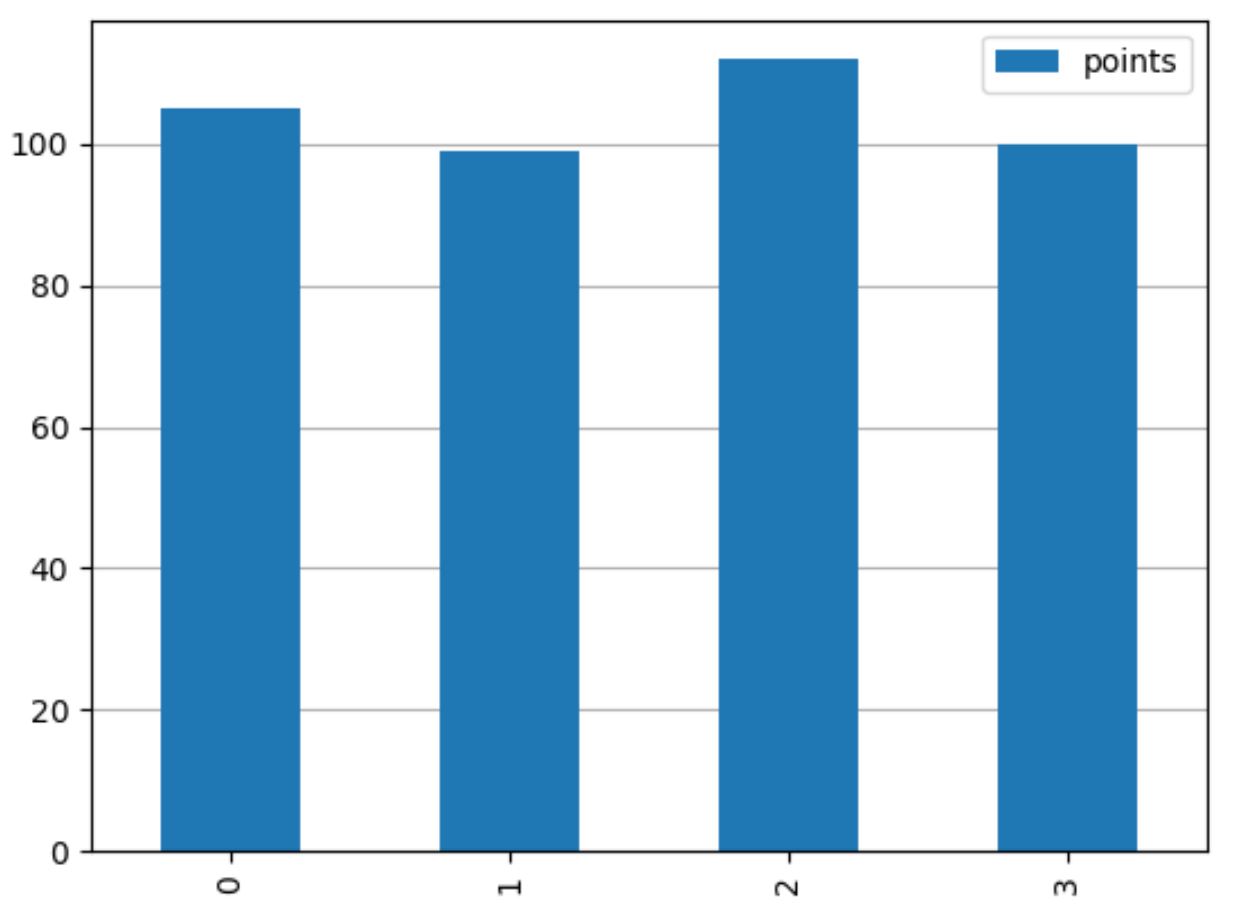
N’hésitez pas à utiliser ax.set_axisbelow(True) pour afficher le quadrillage horizontal derrière les barres dans le tracé :
import pandas as pd
import matplotlib.pyplot as plt

#create DataFrame
df = pd.DataFrame({'team':['Mavs', 'Nets', 'Spurs', 'Warriors'],
                   'points':[105, 99, 112, 100]})

#define plot
fig, ax = plt.subplots()

#create bar plot
df.plot(kind='bar', ax=ax)

#add horizontal gridlines behind bars in the plot
ax.set_axisbelow(True)
ax.grid(axis='y')

#display plot
plt.show()
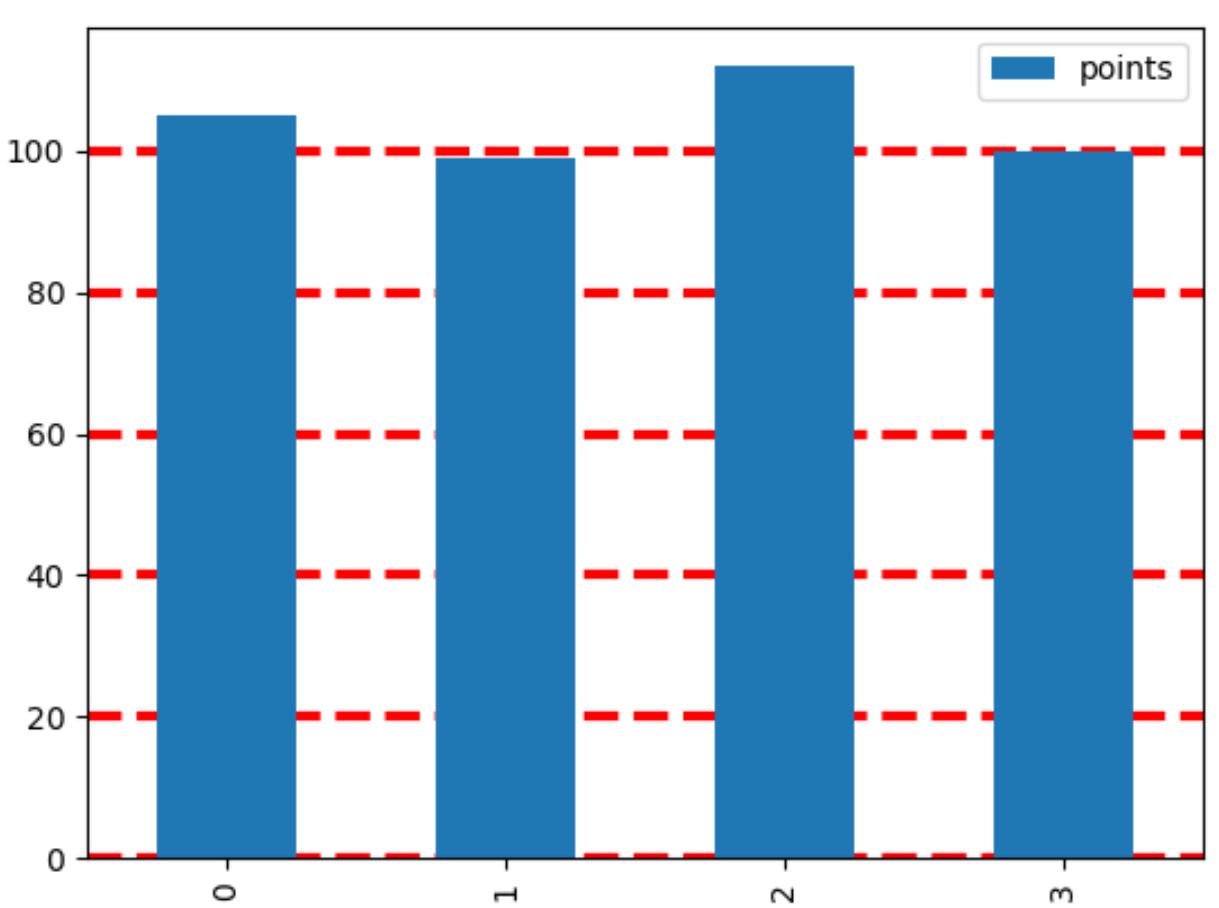
Et n’hésitez pas à utiliser les arguments color , linestyle et linewidth dans la fonction grid() pour personnaliser l’apparence du quadrillage :
import pandas as pd
import matplotlib.pyplot as plt

#create DataFrame
df = pd.DataFrame({'team':['Mavs', 'Nets', 'Spurs', 'Warriors'],
                   'points':[105, 99, 112, 100]})

#define plot
fig, ax = plt.subplots()

#create bar plot
df.plot(kind='bar', ax=ax)

#add horizontal gridlines with custom appearance
ax.set_axisbelow(True)
ax.grid(axis='y', color='red', linestyle='dashed', linewidth=3)

#display plot
plt.show()
Vous pouvez trouver une liste complète des façons de personnaliser le quadrillage dans la documentation Matplotlib .
Ressources additionnelles
Les didacticiels suivants expliquent comment effectuer d’autres tâches courantes dans Matplotlib :
Comment supprimer les tiques des tracés Matplotlib
Comment modifier la taille des polices sur un tracé Matplotlib
Comment ajouter une ligne moyenne au tracé dans Matplotlib
à propos de l'auteur
Dr. Benjamin Anderson
Il est un professeur de statistiques à la retraite devenu éducateur dévoué sur Statorials. Avec une vaste expérience et une expertise dans le domaine des statistiques, je m'engage à partager mes connaissances pour responsabiliser les étudiants grâce à Statorials. Lire plus