Correlation coefficient ဖြင့် seaborn scatter plot ကိုဖန်တီးနည်း
Seaborn တွင် scatterplot တစ်ခုဖန်တီးရန် အောက်ပါအခြေခံ syntax ကို သင်အသုံးပြုနိုင်ပြီး ဇာတ်လမ်းတွင် ဆက်စပ်ကိန်းကို ပေါင်းထည့်နိုင်သည်-
 import scipy
import matplotlib. pyplot as plt
import seaborn as sns

#calculate correlation coefficient between x and y
r = scipy. stats . pearsonr (x=df. x , y=df. y )[0]

#create scatterplot
sns. scatterplot (data=df, x=df. x , y=df. y )

#add correlation coefficient to plot
plt. text (5, 30, ' r = ' + str ( round (r,2)))
အောက်ဖော်ပြပါ ဥပမာသည် ဤ syntax ကို လက်တွေ့တွင် မည်သို့အသုံးပြုရမည်ကို ပြသထားသည်။
ဥပမာ- Correlation Coefficient ဖြင့် Seaborn Scatterplot တစ်ခုကို ဖန်တီးပါ။
ကျွန်ုပ်တို့တွင် ဘတ်စကတ်ဘောကစားသမားအမျိုးမျိုး၏ အမှတ်များနှင့် ပံ့ပိုးကူညီမှုများကို ပြသပေးသည့် အောက်ပါပန်ဒါ DataFrame ရှိသည် ဆိုကြပါစို့။
 import pandas as pd

#createDataFrame
df = pd. DataFrame ({' team ': ['A', 'A', 'A', 'A', 'B', 'C', 'C', 'C', 'D', 'D'],
                   ' points ': [12, 11, 18, 15, 14, 20, 25, 24, 32, 30],
                   ' assists ': [4, 7, 7, 8, 9, 10, 10, 12, 10, 15]})

#view DataFrame
print (df)

  team points assists
0 to 12 4
1 to 11 7
2 To 18 7
3 to 15 8
4 B 14 9
5 C 20 10
6 C 25 10
7 C 24 12
8 D 32 10
9 D 30 15
ဖြတ်သန်းမှုများနှင့် ရမှတ်များကြား ဆက်စပ်မှုကို မြင်ယောင်ရန် အောက်ပါ syntax ကို အသုံးပြုနိုင်ပြီး အဆိုပါ variable နှစ်ခုကြားရှိ ဆက်စပ်ကိန်းများကို တွက်ချက်ရန် scipy ‘s pearsonr() လုပ်ဆောင်ချက်ကိုလည်း အသုံးပြုနိုင်ပါသည်။
 import scipy
import matplotlib. pyplot as plt
import seaborn as sns

#calculate correlation coefficient between assists and points
r = scipy. stats . pearsonr (x=df. assists , y=df. points )[0]

#create scatterplot
sns. scatterplot (data=df, x=df. assists , y=df. points )

#add correlation coefficient to plot
plt. text (5, 30, ' r = ' + str ( round (r,2)))
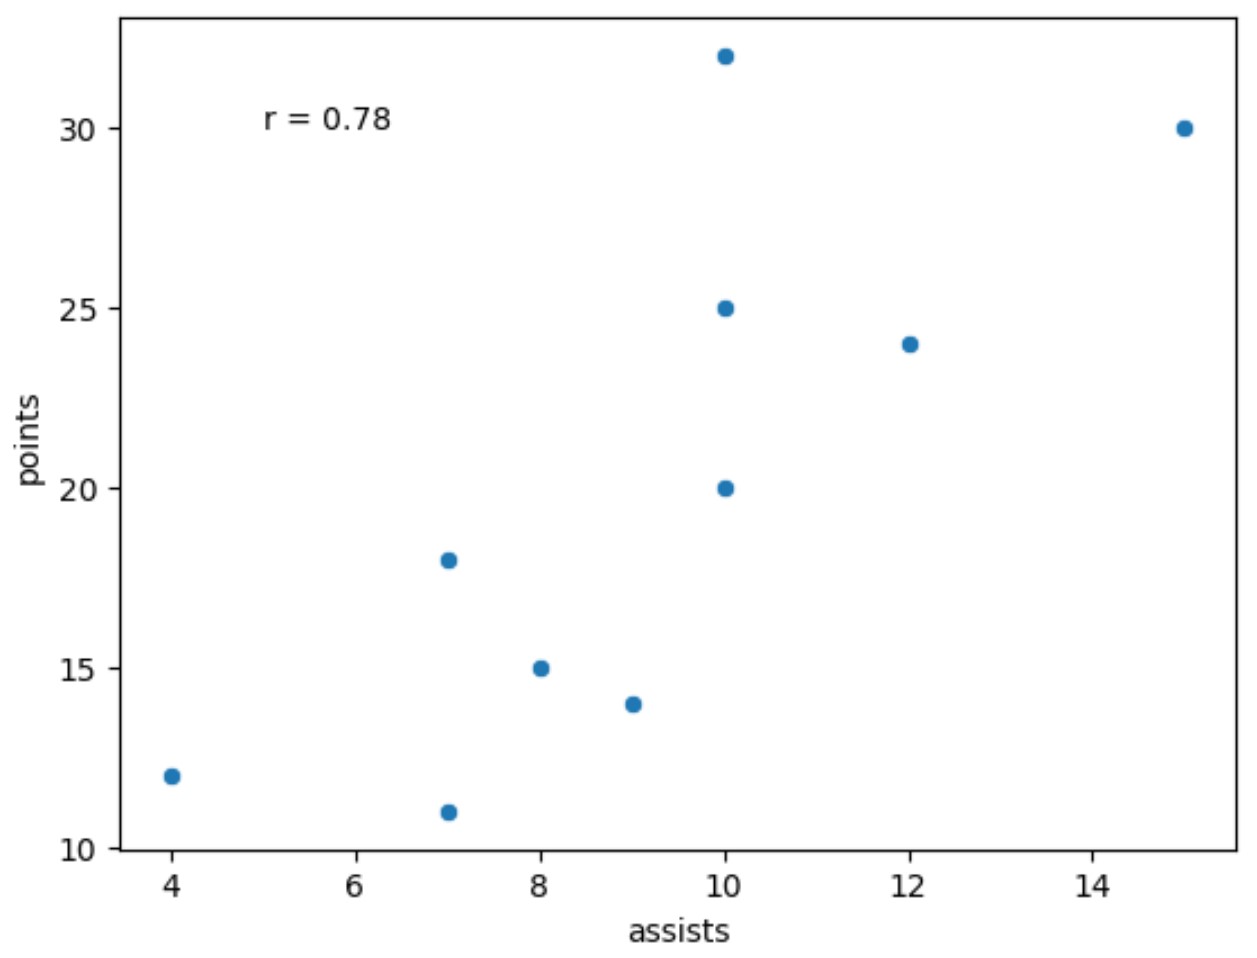
ရလဒ်မှ၊ ပံ့ပိုးမှုနှင့်ရမှတ်များကြားရှိ Pearson ဆက်စပ်ကိန်းသည် 0.78 ဖြစ်သည်ကို ကျွန်ုပ်တို့တွေ့နိုင်သည်။
ဆက်စပ်မှု- အဘယ်အရာကို “ခိုင်မာသော” ဆက်စပ်မှုဟု ယူဆသနည်း။
ဆက်စပ်ကိန်းကို ဒဿမနေရာနှစ်ခုသို့ ပတ်ရန် round() လုပ်ဆောင်ချက်ကို အသုံးပြုခဲ့ကြောင်း သတိပြုပါ။
မတူညီသော ဒဿမနေရာများကို လွတ်လပ်စွာ လှည့်ပတ်နိုင်ပြီး ကွက်လပ်ပေါ်ရှိ ဆက်စပ်ကိန်း၏ ဖောင့်အရွယ်အစားကို ပြောင်းလဲရန် ဖောင့်အရွယ်အစား အငြင်းအခုံကိုလည်း လွတ်လပ်စွာ အသုံးပြုနိုင်ပါသည်။
 import scipy
import matplotlib. pyplot as plt
import seaborn as sns

#calculate correlation coefficient between assists and points
r = scipy. stats . pearsonr (x=df. assists , y=df. points )[0]

#create scatterplot
sns. scatterplot (data=df, x=df. assists , y=df. points )

#add correlation coefficient to plot
plt. text (5, 30, ' r= '+ str ( round (r,4)), fontsize= 20 ))
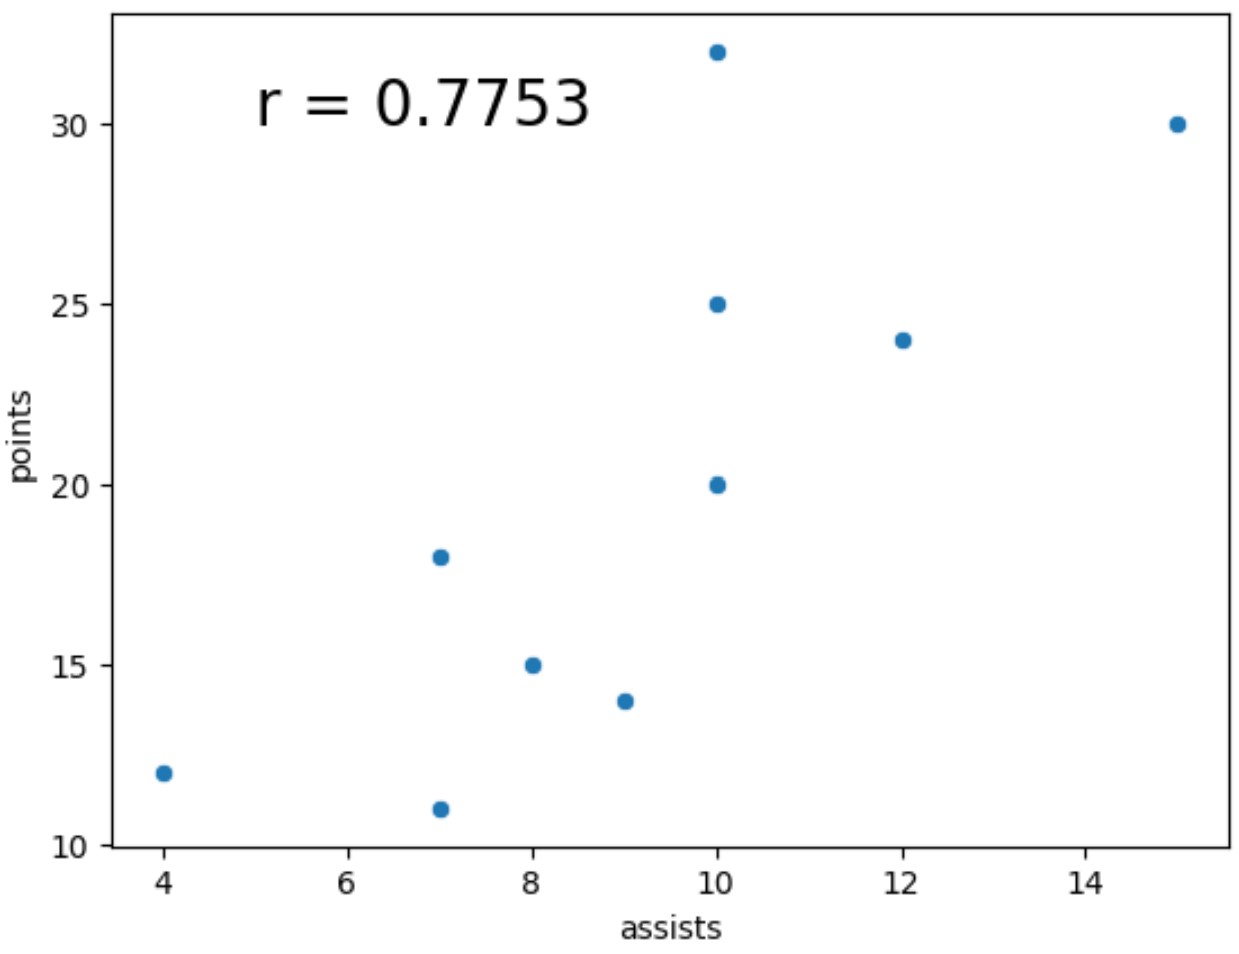
ဆက်စပ်ကိန်းကို ယခုအခါ ဒဿမ လေးနေရာသို့ ပတ်ထားပြီး ဖောင့်အရွယ်အစားသည် ယခင်ဥပမာထက် များစွာပိုကြီးသည်ကို သတိပြုပါ။
မှတ်ချက် – seaborn scatterplot() လုပ်ဆောင်ချက်အတွက် စာရွက်စာတမ်းအပြည့်အစုံကို ဤနေရာတွင် ရှာဖွေနိုင်ပါသည်။
ထပ်လောင်းအရင်းအမြစ်များ
အောက်ဖော်ပြပါ သင်ခန်းစာများသည် ပင်လယ်မွေးတွင် အခြားဘုံလုပ်ဆောင်ချက်များကို မည်သို့လုပ်ဆောင်ရမည်ကို ရှင်းပြသည်-
Seaborn တွင် ဖြန့်ချီပုံဆွဲနည်း
Seaborn ရှိ x-axis ပေါ်ရှိ boxplot များကို မည်သို့မှာယူမည်နည်း။
Seaborn ဇာတ်ကွက်တွင် ဇယားတစ်ခုထည့်နည်း
စာရေးသူအကြောင်း
Benjamin Anderson
မင်္ဂလာပါ၊ ကျွန်ုပ်သည် အငြိမ်းစား စာရင်းအင်း ပါမောက္ခ ဘင်ဂျမင်ဖြစ်ပြီး သီးသန့် Statorials ဆရာအဖြစ် လှည့်ပတ်ပါသည်။ စာရင်းဇယားနယ်ပယ်တွင် ကျယ်ပြန့်သောအတွေ့အကြုံနှင့် ကျွမ်းကျင်မှုနှင့်အတူ၊ Statorials မှတစ်ဆင့် ကျောင်းသားများကို ခွန်အားဖြစ်စေရန်အတွက် ကျွန်ုပ်၏အသိပညာကို မျှဝေလိုပါသည်။ ပိုသိတယ်။