ပုံတစ်ပုံတည်းတွင် များစွာသော seaborn plots ဖန်တီးနည်း
FacetGrid() လုပ်ဆောင်ချက်ကို ပုံတစ်ခုတည်းတွင် Seaborn ကွက်များစွာ ဖန်တီးနိုင်သည်-
 #definegrid
g = sns. FacetGrid (data=df, col=' variable1 ', col_wrap= 2 )

#add plots to grid
g. map ( sns.scatterplot , ' variable2 ', ' variable3 ')
col argument သည် wrap လုပ်ရန် variable ကို သတ်မှတ်ပေးပြီး col_wrap argument သည် စာကြောင်းတစ်ခုစီတွင် ပြသရန် ကွက်နံပါတ်များကို သတ်မှတ်ကြောင်း သတိပြုပါ။
အောက်ဖော်ပြပါနမူနာများသည် built-in “tips” dataset ဖြင့် ဤလုပ်ဆောင်ချက်ကို လက်တွေ့အသုံးချနည်းကို ပြသသည်-
 #load tips dataset
tips = sns. load_dataset (' tips ')

#view first five rows of tips dataset
tips. head ()

   total_bill tip sex smoker day time size
0 16.99 1.01 Female No Sun Dinner 2
1 10.34 1.66 Male No Sun Dinner 3
2 21.01 3.50 Male No Sun Dinner 3
3 23.68 3.31 Male No Sun Dinner 2
4 24.59 3.61 Female No Sun Dinner 4
ဥပမာ 1- လမ်းကြောင်းများစွာကို ဖန်တီးပါ။
အောက်ပါကုဒ်သည် ပုံတစ်ခုတည်းတွင် Seaborn ဇာတ်ကွက်များစွာကို ဖန်တီးနည်းကို ပြသသည်-
 #define grid with two plots per row
g = sns. FacetGrid (data=tips, col=' day ', col_wrap= 2 )

#add histograms to each plot
g. map (sns. histplot , ' tip ')
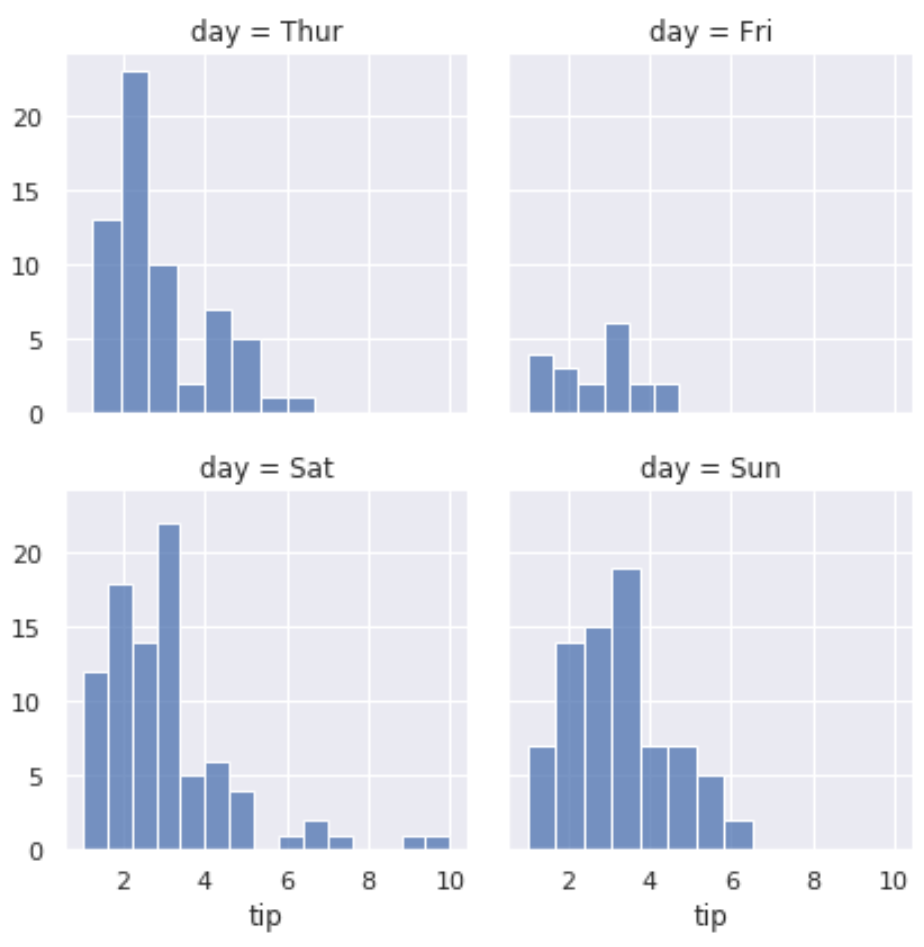
ဤရိုးရှင်းသောကုဒ်ဖြင့် ကျွန်ုပ်တို့လုပ်ဆောင်ခဲ့သည်မှာ-
- ပြောင်းလဲနိုင်သော ‘ရက်’ ဖြင့် အုပ်စုသို့ သတ်မှတ်ထားသည်
- တစ်ကြောင်းလျှင် ၂ကွက်ပြသရန် သတ်မှတ်ထားသည်။
- သီးခြားနေ့ရက်တစ်ခုစီအတွက် “ tip” တန်ဖိုးများကို ဖြန့်ကျက်ပြသသည့်ကွက်တစ်ခုစီတွင် ဟီစတိုဂရမ်တစ်ခုပြသရန် သတ်မှတ်ထားသည်
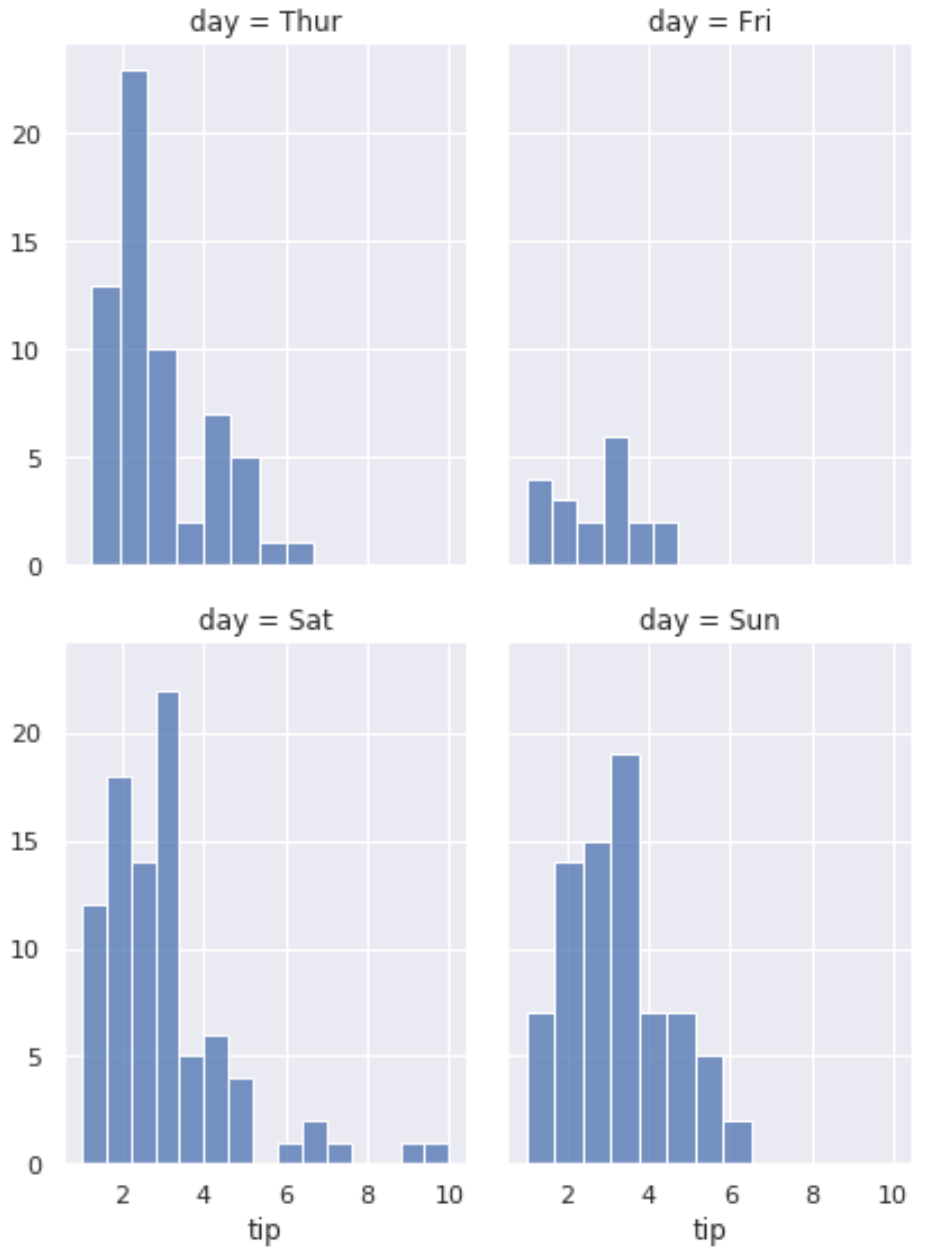
ဥပမာ 2- သတ်မှတ်ထားသော အမြင့်ဖြင့် လမ်းကြောင်းများစွာကို ဖန်တီးပါ။
အောက်ပါကုဒ်သည် တိကျသောအမြင့်နှင့် ရှုထောင့်အချိုးဖြင့် Seaborn ကွက်များစွာကို ဖန်တီးနည်းကို ပြသသည်-
 #definegrid
g = sns. FacetGrid (data=tips, col=' day ', col_wrap= 2 , height= 4 , aspect= .75 )

#add histograms to each plot
g. map (sns. histplot , ' tip ')
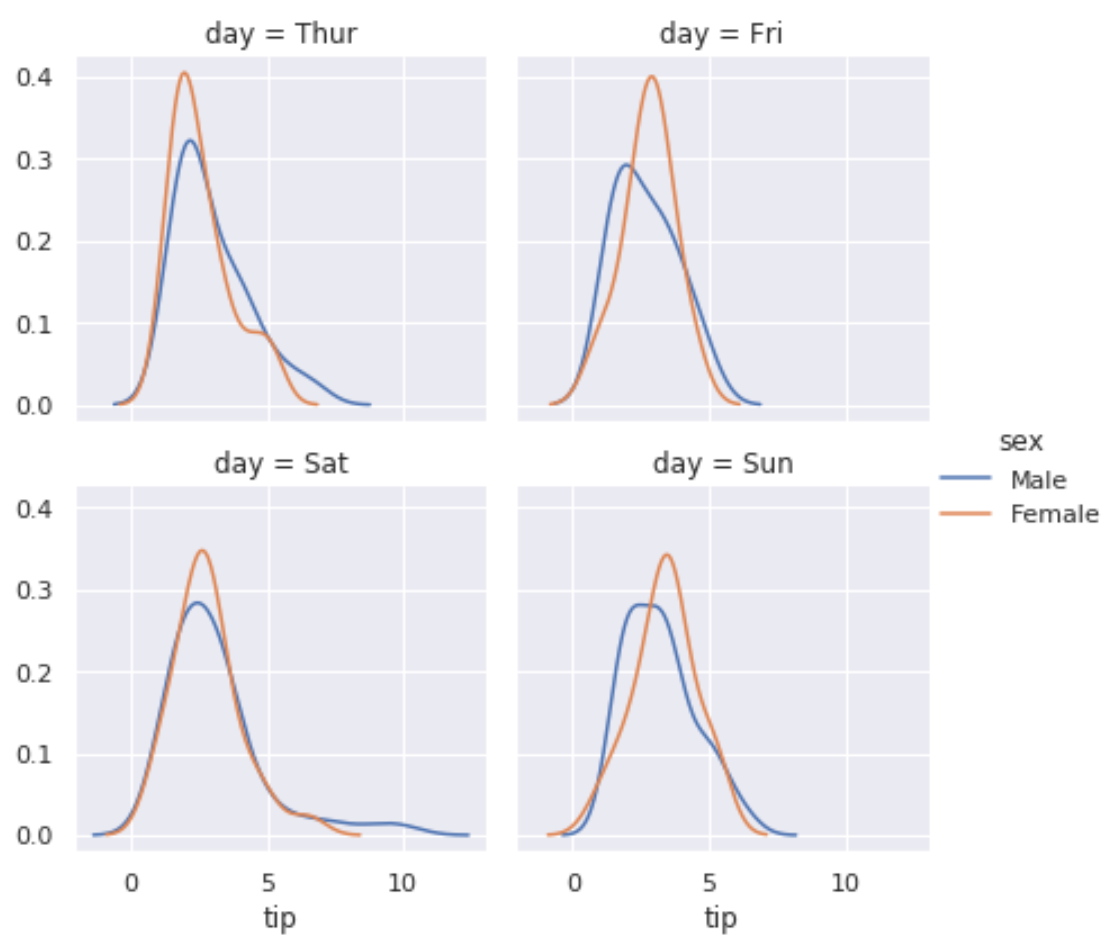
ဥပမာ 3- ဒဏ္ဍာရီဖြင့် ဇာတ်ကွက်များစွာ ဖန်တီးပါ။
အောက်ပါကုဒ်သည် Seaborn ဇာတ်ကွက်များစွာကို ဖန်တီးပြီး ဒဏ္ဍာရီတစ်ခုကို ထည့်သွင်းနည်းကို ပြသသည်-
 #definegrid
g = sns. FacetGrid (data=tips, col=' day ', hue=' sex ', col_wrap= 2 )

#add density plots to each plot
g. map ( sns.kdeplot , ' tip ')

#add legend
g. add_legend ()
ထပ်လောင်းအရင်းအမြစ်များ
Seaborn Plots တွင် ခေါင်းစဉ်တစ်ခုထည့်နည်း
Seaborn မှာ ဒဏ္ဍာရီတစ်ယောက်ရဲ့ အနေအထားကို ဘယ်လိုပြောင်းမလဲ။
Seaborn ဇာတ်ကွက်၏ ပုံအရွယ်အစားကို ချိန်ညှိနည်း
စာရေးသူအကြောင်း
Benjamin Anderson
မင်္ဂလာပါ၊ ကျွန်ုပ်သည် အငြိမ်းစား စာရင်းအင်း ပါမောက္ခ ဘင်ဂျမင်ဖြစ်ပြီး သီးသန့် Statorials ဆရာအဖြစ် လှည့်ပတ်ပါသည်။ စာရင်းဇယားနယ်ပယ်တွင် ကျယ်ပြန့်သောအတွေ့အကြုံနှင့် ကျွမ်းကျင်မှုနှင့်အတူ၊ Statorials မှတစ်ဆင့် ကျောင်းသားများကို ခွန်အားဖြစ်စေရန်အတွက် ကျွန်ုပ်၏အသိပညာကို မျှဝေလိုပါသည်။ ပိုသိတယ်။