Ggplot2 တွင် axis labels များကို လှည့်နည်း (ဥပမာများနှင့်အတူ)
ggplot2 ကွက်ကွက်တွင် ဝင်ရိုးအညွှန်းများကို လှည့်ရန် အောက်ပါ syntax ကို သုံးနိုင်သည်။
p + theme(axis. text . x = element_text(angle = 45 , vjust = 1 , hjust= 1 ))
ထောင့်သည် စာသား၏ ဒေါင်လိုက်နှင့် အလျားလိုက်မျှတမှုကို vjust နှင့် hjust က ထိန်းချုပ်နေချိန်တွင် စာသား၏ထောင့်ကို ထိန်းချုပ်သည်။
အောက်ဖော်ပြပါ အဆင့်ဆင့် ဥပမာသည် ဤ syntax ကို လက်တွေ့တွင် မည်သို့အသုံးပြုရမည်ကို ပြသထားသည်။
အဆင့် 1: ဒေတာဘောင်ကိုဖန်တီးပါ။
ဦးစွာ၊ ရိုးရှင်းသောဒေတာဘောင်တစ်ခုကို ဖန်တီးကြပါစို့။
 #create data frame
df = data. frame (team=c('The Amazing Amazon Anteaters',
                       'The Rowdy Racing Raccoons',
                       'The Crazy Camping Cobras'),
                dots=c(14, 22, 11))

#view data frame
df

                          team points
1 The Amazing Amazon Anteaters 14
2 The Rowdy Racing Raccoons 22
3 The Crazy Camping Cobras 11
အဆင့် 2: Bar Plot ဖန်တီးပါ။
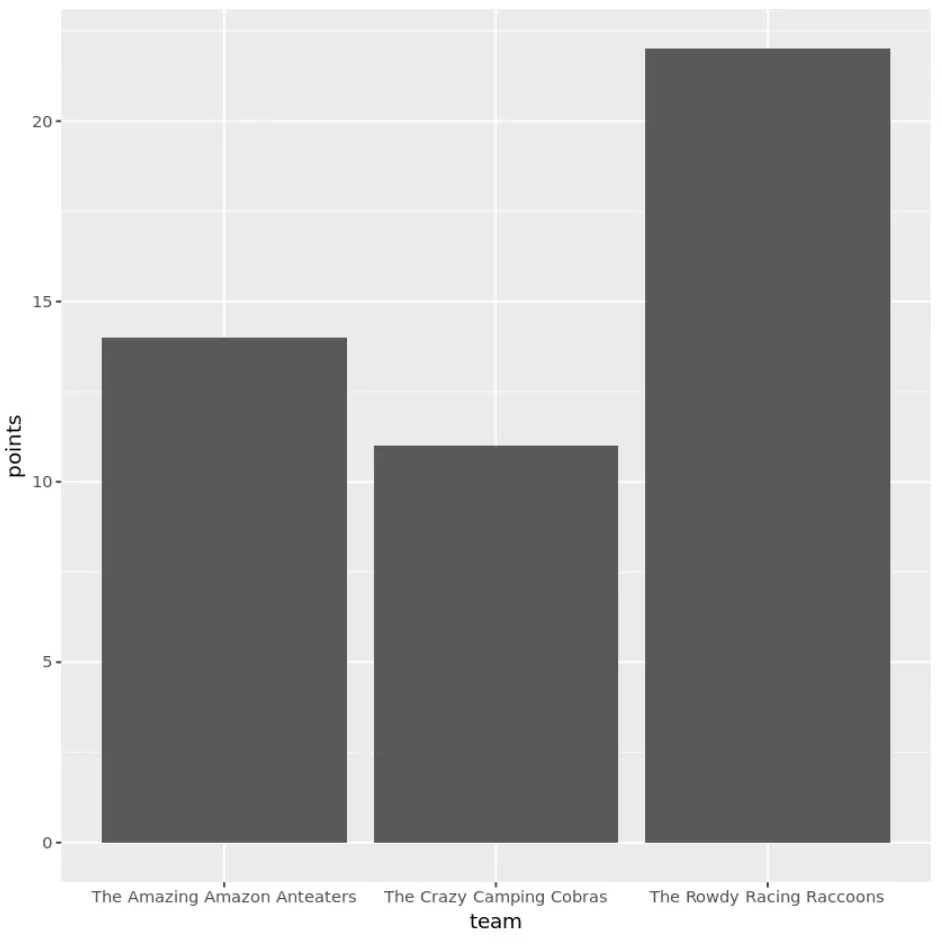
ထို့နောက်၊ အသင်းတစ်ခုစီမှ ရမှတ်များကို မြင်သာစေရန် ဘားဇယားတစ်ခုကို ဖန်တီးကြပါစို့။
 library (ggplot2)

#create bar plot
ggplot(data=df, aes (x=team, y=points)) +
  geom_bar(stat=" identity ")
အဆင့် 3- ကွက်ကွက်ဝင်ရိုးအညွှန်းများကို လှည့်ပါ။
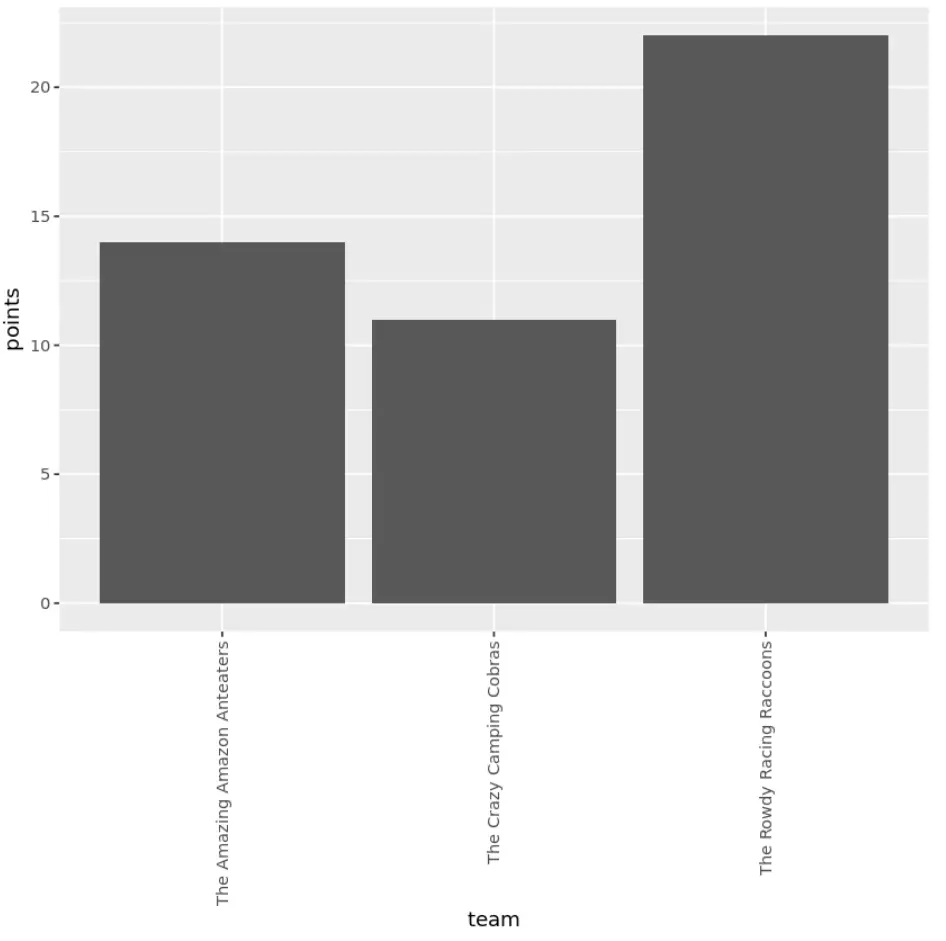
x-axis အညွှန်းများကို 90 ဒီဂရီလှည့်ရန် အောက်ပါကုဒ်ကို အသုံးပြုနိုင်သည်။
 library (ggplot2)

#create bar plot with axis labels rotated 90 degrees
ggplot(data=df, aes (x=team, y=points)) +
  geom_bar(stat=" identity ") +
  theme(axis. text . x = element_text(angle= 90 , vjust= .5 , hjust= 1 ))
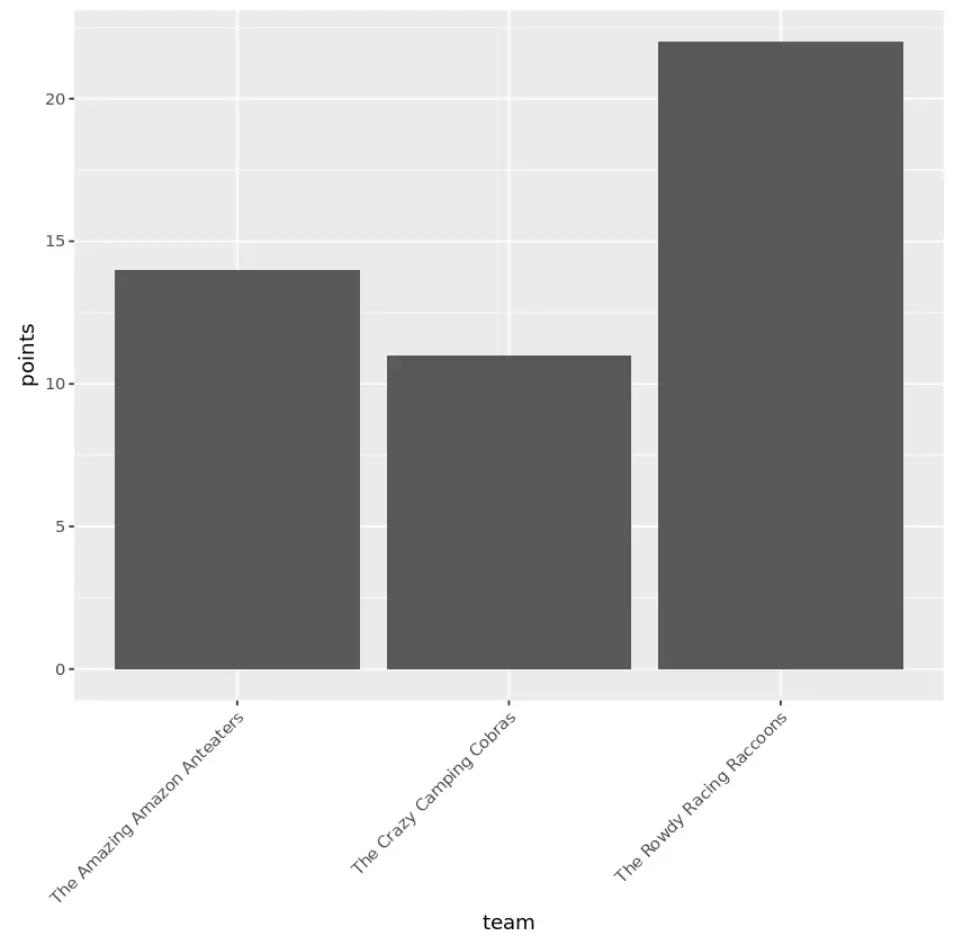
သို့မဟုတ် ကျွန်ုပ်တို့သည် X ဝင်ရိုးအညွှန်းများကို 45 ဒီဂရီဖြင့်လှည့်ရန် အောက်ပါကုဒ်ကိုသုံးနိုင်သည်။
 library (ggplot2)

#create bar plot with axis labels rotated 90 degrees
ggplot(data=df, aes (x=team, y=points)) +
  geom_bar(stat=" identity ") +
  theme(axis. text . x = element_text(angle= 45 , vjust= 1 , hjust= 1 ))
တံဆိပ်များကို သင်လှည့်သည့် ထောင့် ပေါ်မူတည်၍ အညွှန်းများသည် လမ်းကြောင်းနှင့် လုံလောက်စွာနီးကပ်ကြောင်း သေချာစေရန် vjust နှင့် hjust တန်ဖိုးများကို ချိန်ညှိရန် လိုအပ်ပါသည်။
ထပ်လောင်းအရင်းအမြစ်များ
အောက်ဖော်ပြပါ သင်ခန်းစာများသည် ggplot2 တွင် အခြားဘုံအလုပ်များကို မည်သို့လုပ်ဆောင်ရမည်ကို ရှင်းပြသည်-
ggplot2 တွင် ဝင်ရိုးကန့်သတ်ချက်များကို မည်သို့သတ်မှတ်မည်နည်း။
ggplot2 တွင် axes ၏အစီစဥ်ကိုပြန်ပြောင်းနည်း
ggplot2 တွင် gridline များကိုမည်သို့ဖယ်ရှားနည်း
ggplot2 တွင် လိုင်းအထူကို ချိန်ညှိနည်း
စာရေးသူအကြောင်း
Benjamin Anderson
မင်္ဂလာပါ၊ ကျွန်ုပ်သည် အငြိမ်းစား စာရင်းအင်း ပါမောက္ခ ဘင်ဂျမင်ဖြစ်ပြီး သီးသန့် Statorials ဆရာအဖြစ် လှည့်ပတ်ပါသည်။ စာရင်းဇယားနယ်ပယ်တွင် ကျယ်ပြန့်သောအတွေ့အကြုံနှင့် ကျွမ်းကျင်မှုနှင့်အတူ၊ Statorials မှတစ်ဆင့် ကျောင်းသားများကို ခွန်အားဖြစ်စေရန်အတွက် ကျွန်ုပ်၏အသိပညာကို မျှဝေလိုပါသည်။ ပိုသိတယ်။