Seaborn- boxplot တစ်ခုတွင် ပျမ်းမျှတန်ဖိုးကို မည်သို့ပြသမည်နည်း။
seaborn ကို အသုံးပြု၍ ဖန်တီးထားသော boxplots များတွင် ပျမ်းမျှတန်ဖိုးကိုပြသရန် showmeans argument ကို သင်အသုံးပြုနိုင်ပါသည်။
sns. boxplot (data=df, x=' x_var ', y=' y_var ', showmeans= True )
အောက်ဖော်ပြပါ ဥပမာသည် ဤ syntax ကို လက်တွေ့တွင် မည်သို့အသုံးပြုရမည်ကို ပြသထားသည်။
ဥပမာ- Seaborn Boxplot တွင် ပျမ်းမျှတန်ဖိုးကို ပြပါ။
ကျွန်ုပ်တို့တွင် မတူညီသောအသင်းသုံးသင်းမှ ဘတ်စကက်ဘောကစားသမားများမှ ရမှတ်များကိုပြသသည့် အောက်ပါပန်ဒါ DataFrame ရှိသည်ဆိုပါစို့။
 import pandas as pd

#createDataFrame
df = pd. DataFrame ({' team ': ['A', 'A', 'A', 'A', 'A', 'B', 'B', 'B',
                            'B', 'B', 'C', 'C', 'C', 'C', 'C'],
                   ' points ': [3, 4, 6, 8, 9, 10, 13, 16, 18, 20, 8, 9, 12, 13, 15]})

#view head of DataFrame
print ( df.head ())

  team points
0 to 3
1 to 4
2 to 6
3 to 8
4 to 9
အဖွဲ့တစ်ခုစီအတွက် အမှတ်များခွဲဝေမှုကို မြင်သာစေရန် boxplots များဖန်တီးရန် အောက်ပါကုဒ်များကို အသုံးပြုနိုင်ပါသည်။
 import seaborn as sns

#create boxplot to visualize distribution points by team
sns. boxplot (data=df, x=' team ', y=' points ')

မူရင်းအားဖြင့်၊ boxplot များသည် boxplot တစ်ခုစီအတွင်းရှိ အလျားလိုက်မျဉ်းကိုအသုံးပြု၍ ပျမ်းမျှတန်ဖိုးကိုပြသသည်။
boxplot တစ်ခုစီ၏ ပျမ်းမျှတန်ဖိုးကိုပြသရန်၊ showmeans=True ကို သတ်မှတ်ရပါမည်။
 import seaborn as sns

#create boxplot to visualize points distribution by team (and display mean values)
sns. boxplot (data=df, x=' team ', y=' points ', showmeans= True )

ပုံသေအားဖြင့်၊ seaborn သည် boxplot တစ်ခုစီ၏ပျမ်းမျှတန်ဖိုးကိုပြသရန် အစိမ်းရောင်တြိဂံများကိုအသုံးပြုသည်။
ပျမ်းမျှတန်ဖိုး၏အသွင်အပြင်ကို စိတ်ကြိုက်ပြင်ဆင်ရန် Meanprops အငြင်းအခုံကို အသုံးပြုရန် အားမနာပါနှင့်။
 import seaborn as sns

#create boxplot to visualize distribution points by team
sns. boxplot (data=df, x=' team ', y=' points ', showmeans= True ,
            meanprops={' marker ':' o ',
                       ' markerfacecolor ': ' white ',
                       ' markeredgecolor ': ' black ',
                       ' markersize ': ' 8 '})
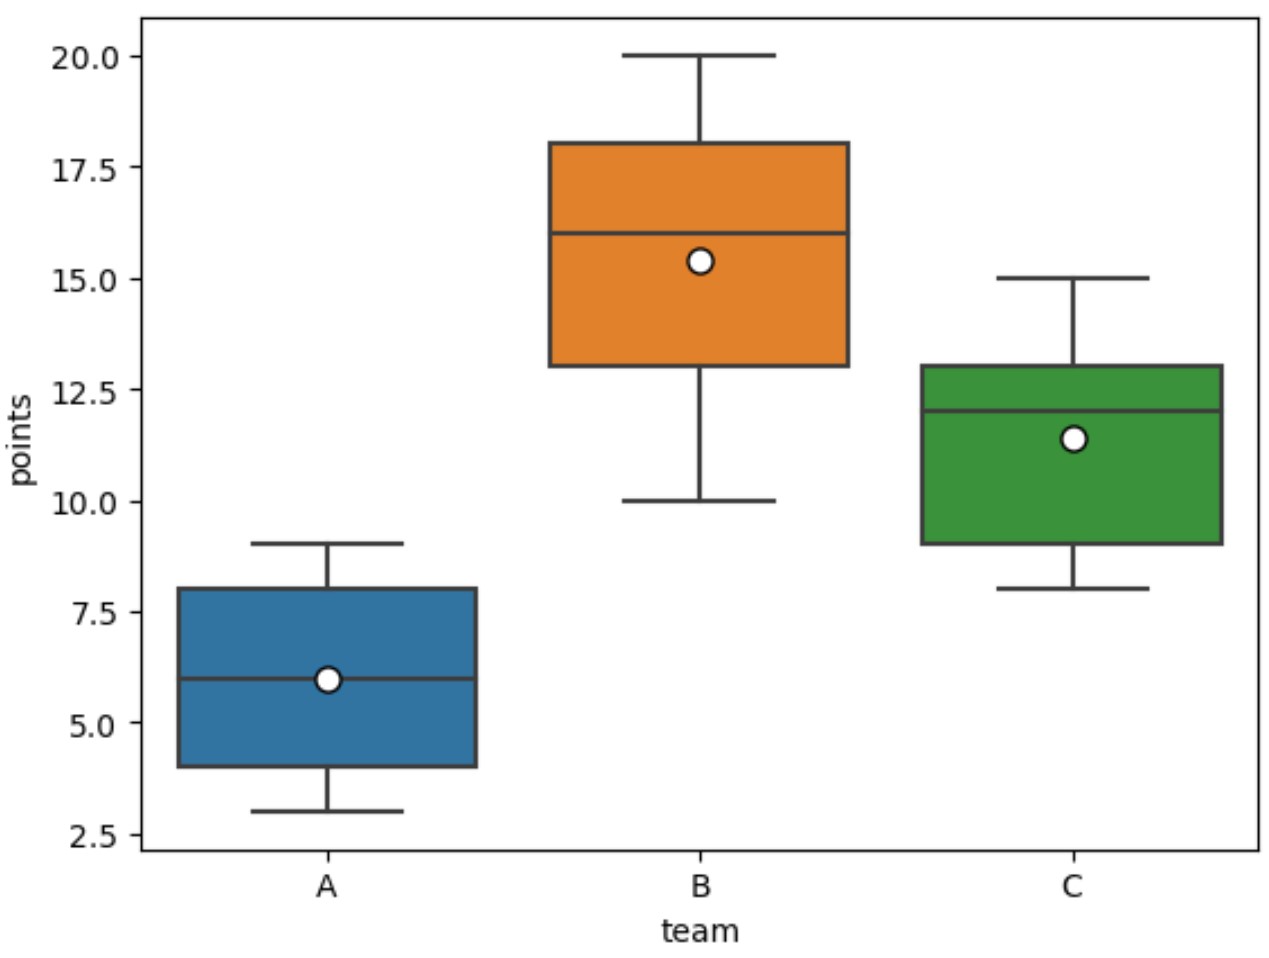
ပျမ်းမျှတန်ဖိုးများကို အနက်ရောင်ကောက်ကြောင်းဖြင့် အဖြူရောင်စက်ဝိုင်းများအဖြစ် ယခုပြသထားပါသည်။
boxplots များရှိ ပျမ်းမျှတန်ဖိုးများ၏ အသွင်အပြင်ကို ပြောင်းလဲရန် Meanprops အငြင်းအခုံတန်ဖိုးများကို လွတ်လပ်စွာကစားပါ။
မှတ်ချက် – seaborn boxplot() လုပ်ဆောင်ချက်အတွက် စာရွက်စာတမ်းအပြည့်အစုံကို ဤနေရာတွင် ရှာဖွေနိုင်ပါသည်။
ထပ်လောင်းအရင်းအမြစ်များ
အောက်ဖော်ပြပါ သင်ခန်းစာများသည် ပင်လယ်မွေးတွင် အခြားဘုံလုပ်ဆောင်ချက်များကို မည်သို့လုပ်ဆောင်ရမည်ကို ရှင်းပြသည်-
Seaborn Boxplot တွင် အရောင်များကို ထိန်းချုပ်နည်း
Seaborn boxplot မှ outliers များကို မည်သို့ဖယ်ရှားနည်း
Seaborn ရှိ x-axis ပေါ်ရှိ boxplot များကို မည်သို့မှာယူမည်နည်း။
စာရေးသူအကြောင်း
Benjamin Anderson
မင်္ဂလာပါ၊ ကျွန်ုပ်သည် အငြိမ်းစား စာရင်းအင်း ပါမောက္ခ ဘင်ဂျမင်ဖြစ်ပြီး သီးသန့် Statorials ဆရာအဖြစ် လှည့်ပတ်ပါသည်။ စာရင်းဇယားနယ်ပယ်တွင် ကျယ်ပြန့်သောအတွေ့အကြုံနှင့် ကျွမ်းကျင်မှုနှင့်အတူ၊ Statorials မှတစ်ဆင့် ကျောင်းသားများကို ခွန်အားဖြစ်စေရန်အတွက် ကျွန်ုပ်၏အသိပညာကို မျှဝေလိုပါသည်။ ပိုသိတယ်။