Ggplot2 ရှိ boxplot များတွင် outliers တံဆိပ်တပ်နည်း
ဤသင်ခန်းစာသည် ggplot2 ရှိ boxplot2 ရှိ boxplot များတွင် outliers တံဆိပ်ကပ်နည်းကို အဆင့်ဆင့် ဥပမာပေးပါသည်။
အဆင့် 1: ဒေတာဘောင်ကိုဖန်တီးပါ။
ပထမဦးစွာ၊ မတူညီသောအသင်းသုံးသင်းတွင် မတူညီသောဘတ်စကက်ဘောကစားသမား 60 မှရမှတ်များပါ၀င်သော အချက်အလက်ဘောင်ကို ဖန်တီးကြပါစို့။
 #make this example reproducible
set. seeds (1)

#create data frame
df <- data. frame (team=rep(c('A', 'B', 'C'), each= 20 ),
                 player=rep(LETTERS[1:20], times= 3 ),
                 points=round(rnorm(n=60, mean=30, sd=10), 2))

#view head of data frame
head(df)

  team player points
1 AA 23.74
2AB 31.84
3 AC 21.64
4AD 45.95
5 AE 33.30
6 FY 21.80
မှတ်ချက် – ဤဥပမာသည် မျိုးပွားနိုင်စေရန် သေချာစေရန် set.seed() လုပ်ဆောင်ချက်ကို အသုံးပြုထားပါသည်။
အဆင့် 2- အကွာအဝေးများကို ခွဲခြားသတ်မှတ်ရန် လုပ်ဆောင်ချက်တစ်ခုကို သတ်မှတ်ပါ။
ggplot2 တွင် အောက်ဖော်ပြပါ လိုအပ်ချက်နှစ်ခုအနက်မှ တစ်ခုနှင့် ကိုက်ညီပါက စောင့်ကြည့်မှုတစ်ခုကို အကြမ်းဖျင်းအဖြစ် သတ်မှတ်သည်-
- စူးစမ်းလေ့လာမှုသည် ပထမ quartile (Q1) အောက်ရှိ interquartile range ၏ 1.5 ဆ၊
- စူးစမ်းလေ့လာမှုသည် တတိယ quartile (Q3) ထက် ကွာတားအကွာအဝေးထက် 1.5 ဆဖြစ်သည်။
ဤလိုအပ်ချက်နှစ်ခုအနက်မှ တစ်ခုနှင့် ကိုက်ညီပါက စောင့်ကြည့်လေ့လာမှုများကို အကြမ်းဖျင်းအဖြစ် တံဆိပ်ကပ်ရန် R တွင် အောက်ပါလုပ်ဆောင်ချက်ကို ဖန်တီးနိုင်သည်-
 find_outlier <- function (x) {
  return (x < quantile(x, .25) - 1.5*IQR(x) | x > quantile(x, .75) + 1.5*IQR(x))
}
ဆက်စပ်- Interquartile Range ကို ဘယ်လိုအဓိပ္ပာယ်ဖွင့်မလဲ။
အဆင့် 3- ggplot2 ရှိ boxplot များတွင် outliers များကို အညွှန်းတပ်ပါ။
ထို့နောက် ggplot2 ရှိ boxplot2 တွင် outliers များကို အညွှန်းတပ်ရန် အောက်ပါကုဒ်ကို အသုံးပြုနိုင်သည်။
 library (ggplot2)
library (dplyr)

#add new column to data frame that indicates if each observation is an outlier
df <- df %>%
        group_by(team) %>%
        mutate(outlier = ifelse(find_outlier(points), points, NA))

#create box plot of points by team and label outliers
ggplot(df, aes(x=team, y=points)) +
  geom_boxplot() +
  geom_text(aes(label=outlier), na. rm = TRUE , hjust= -.5 )
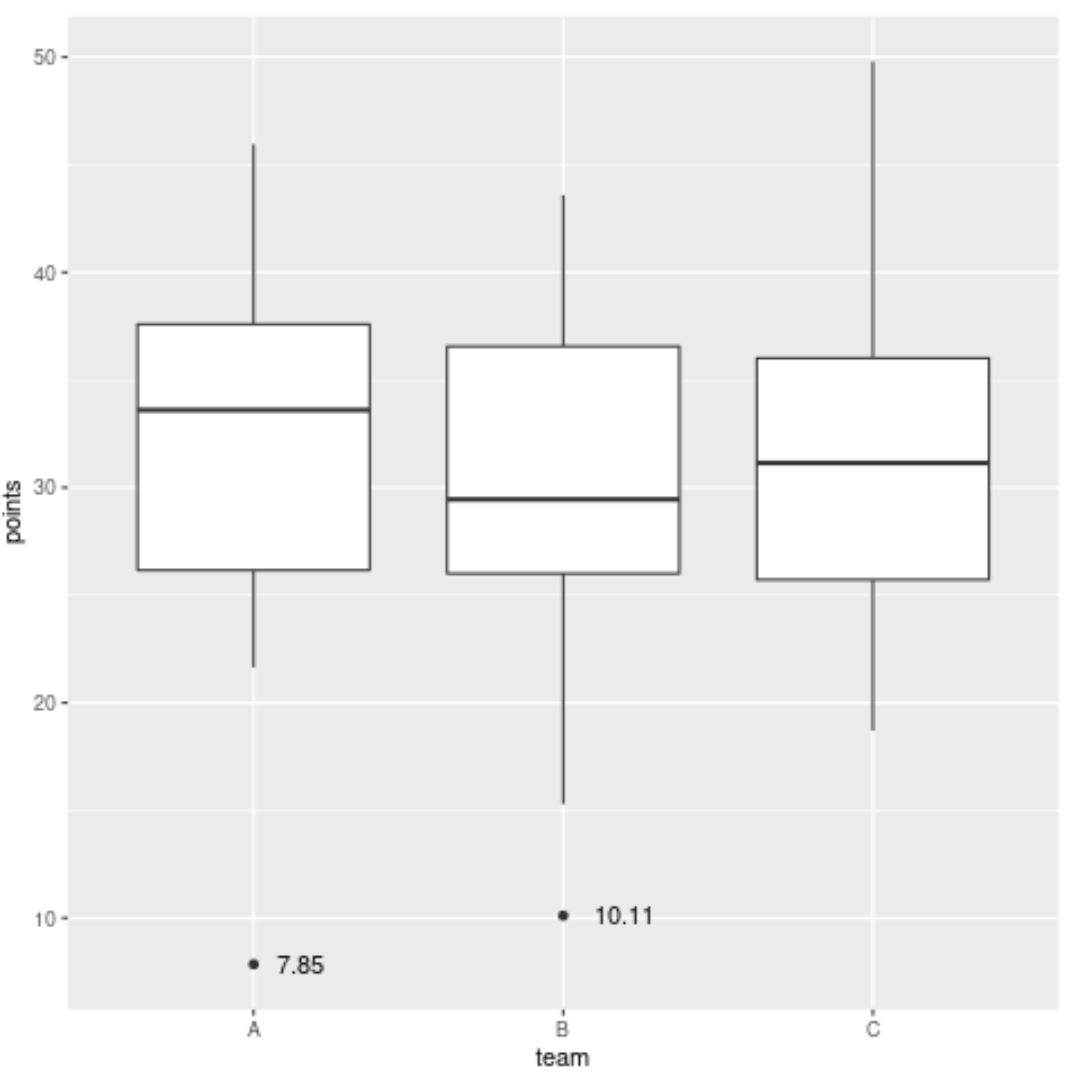
ဂရပ်တွင် အထွက်နှစ်ခုကို အညွှန်းတပ်ထားကြောင်း သတိပြုပါ။
ပထမအစွန်လူမှာ အသင်း A မှ ရမှတ် 7.85 မှတ်ရရှိသည့် ကစားသမားဖြစ်ပြီး အခြားအစွန်းထွက်သူများသည် အသင်း B မှ 10.11 မှတ်ရရှိသော ကစားသမားဖြစ်သည်။
ဤအကွာအဝေးများကို အညွှန်းတပ်ရန် မတူညီသော ကိန်းရှင်တစ်ခုကိုလည်း အသုံးပြုနိုင်ကြောင်း သတိပြုပါ။
ဥပမာအားဖြင့်၊ ကျွန်ုပ်တို့သည် ကစားသမား၏အမည်ကိုအခြေခံ၍ mutate() လုပ်ဆောင်ချက်ရှိ ကစားသမား၏ အမှတ်များကို ကစားသမား၏အမည်ပေါ်အခြေခံ၍ အညွှန်းအကွာအဝေးများကို လဲလှယ်နိုင်သည်-
 library (ggplot2)
library (dplyr)

#add new column to data frame that indicates if each observation is an outlier
df <- df %>%
        group_by(team) %>%
        mutate(outlier = ifelse(find_outlier(points), player, NA))

#create box plot of points by team and label outliers
ggplot(df, aes(x=team, y=points)) +
  geom_boxplot() +
  geom_text(aes(label=outlier), na. rm = TRUE , hjust= -.5 )
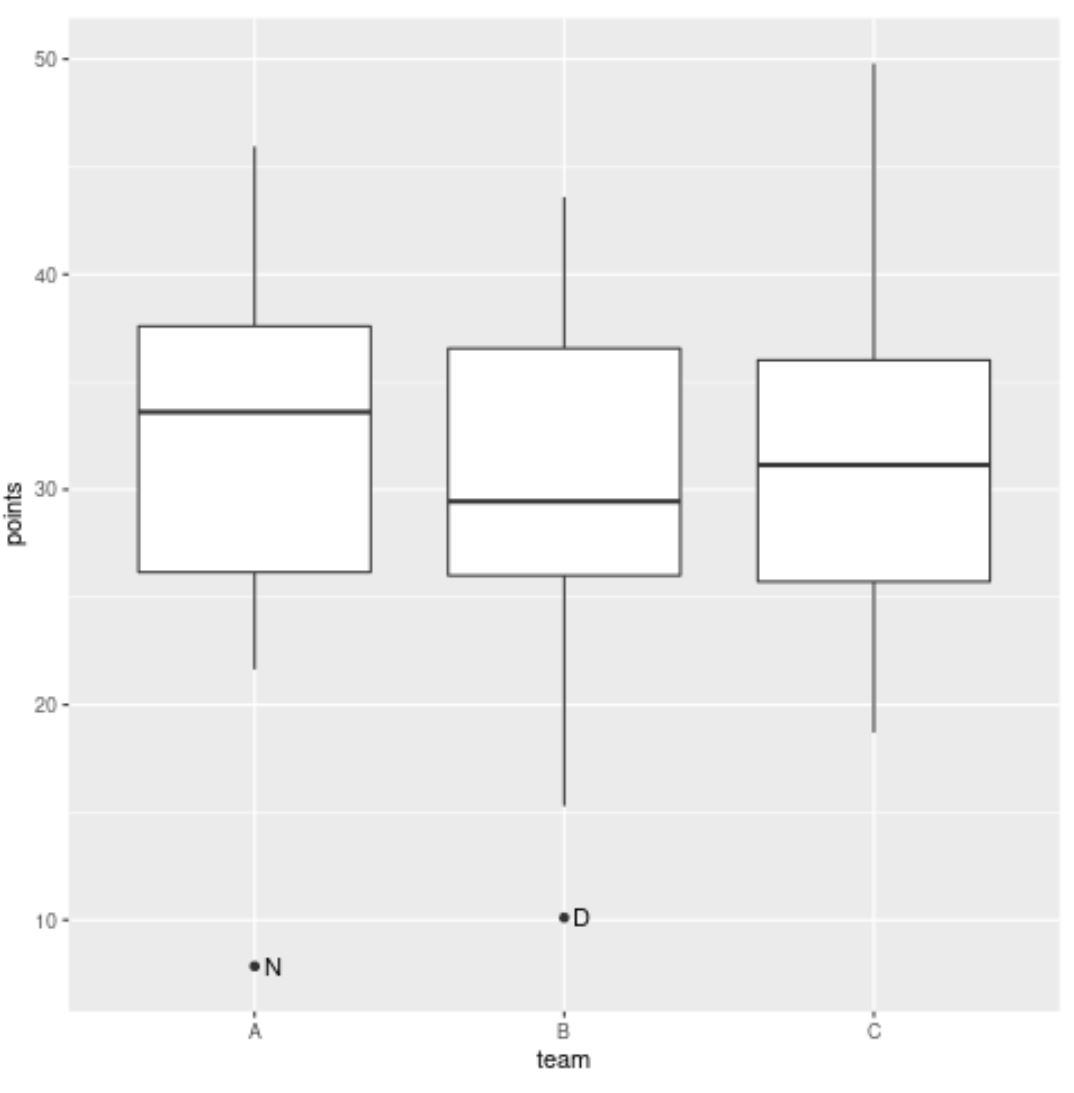
Team A ၏ အထွက်နှုန်းသည် ယခုတွင် တံဆိပ် N ရှိပြီး အသင်း B ၏ အထွက်သည် ယခုအခါ အညွှန်း D ရှိသည်၊ ၎င်းတို့သည် ရမှတ်အကွာအဝေးရှိသည့် ကစားသမားများ၏ အမည်များကို ကိုယ်စားပြုသောကြောင့်၊
မှတ်ချက် – geom_text() ရှိ hjust argument ကို အညွှန်းကို ညာဘက်သို့ အလျားလိုက် တွန်းရန်အတွက် အသုံးပြုသည်
ထပ်လောင်းအရင်းအမြစ်များ
အောက်ဖော်ပြပါ သင်ခန်းစာများသည် ggplot2 တွင် အခြားဘုံအလုပ်များကို မည်သို့လုပ်ဆောင်ရမည်ကို ရှင်းပြသည်-
ggplot2 မှာ ဖောင့်အရွယ်အစားကို ဘယ်လိုပြောင်းမလဲ။
ggplot2 တွင်ဒဏ္ဍာရီကိုမည်သို့ဖယ်ရှားနည်း
ggplot2 တွင် ဝင်ရိုးတံဆိပ်များကို လှည့်နည်း
စာရေးသူအကြောင်း
Benjamin Anderson
မင်္ဂလာပါ၊ ကျွန်ုပ်သည် အငြိမ်းစား စာရင်းအင်း ပါမောက္ခ ဘင်ဂျမင်ဖြစ်ပြီး သီးသန့် Statorials ဆရာအဖြစ် လှည့်ပတ်ပါသည်။ စာရင်းဇယားနယ်ပယ်တွင် ကျယ်ပြန့်သောအတွေ့အကြုံနှင့် ကျွမ်းကျင်မှုနှင့်အတူ၊ Statorials မှတစ်ဆင့် ကျောင်းသားများကို ခွန်အားဖြစ်စေရန်အတွက် ကျွန်ုပ်၏အသိပညာကို မျှဝေလိုပါသည်။ ပိုသိတယ်။