Ggplot2 ရှိ stacked bart ဇယားတွင် ဘားအရောင်များကို မည်သို့ပြောင်းရမည်နည်း။
ggplot2 ရှိ stacked bar chart တစ်ခုတွင် bars များ၏အရောင်ကိုပြောင်းရန် အောက်ပါအခြေခံ syntax ကိုသုံးနိုင်သည်။
 #create stacked bar chart
ggplot(df, aes(x=x_var, y=y_var, fill=fill_var)) +
  geom_bar(position=' stack ', stat=' identity ') +
  scale_fill_manual(values=c(' red ', ' purple ', ' pink ', ...))
အောက်ဖော်ပြပါ ဥပမာသည် ဤ syntax ကို လက်တွေ့တွင် မည်သို့အသုံးပြုရမည်ကို ပြသထားသည်။
ဥပမာ- ggplot2 ရှိ stacked bar chart တွင် ဘားများ၏အရောင်ကို ပြောင်းပါ။
မတူညီသော ဘတ်စကက်ဘောကစားသမားများမှ ရမှတ်များကိုပြသသည့် R တွင် အောက်ပါဒေတာဘောင်ရှိသည်ဆိုပါစို့။
 #create data frame
df <- data. frame (team=c('A', 'A', 'A', 'B', 'B', 'B', 'C', 'C', 'C'),
                 position=c('G', 'F', 'C', 'G', 'F', 'C', 'G', 'F', 'C'),
                 points=c(22, 12, 10, 30, 12, 17, 28, 23, 20))

#view data frame
df

  team position points
1 AG 22
2 AF12
3 AC 10
4 BG 30
5 BF 12
6 BC 17
7 GC 28
8 CF 23
9 CC 20
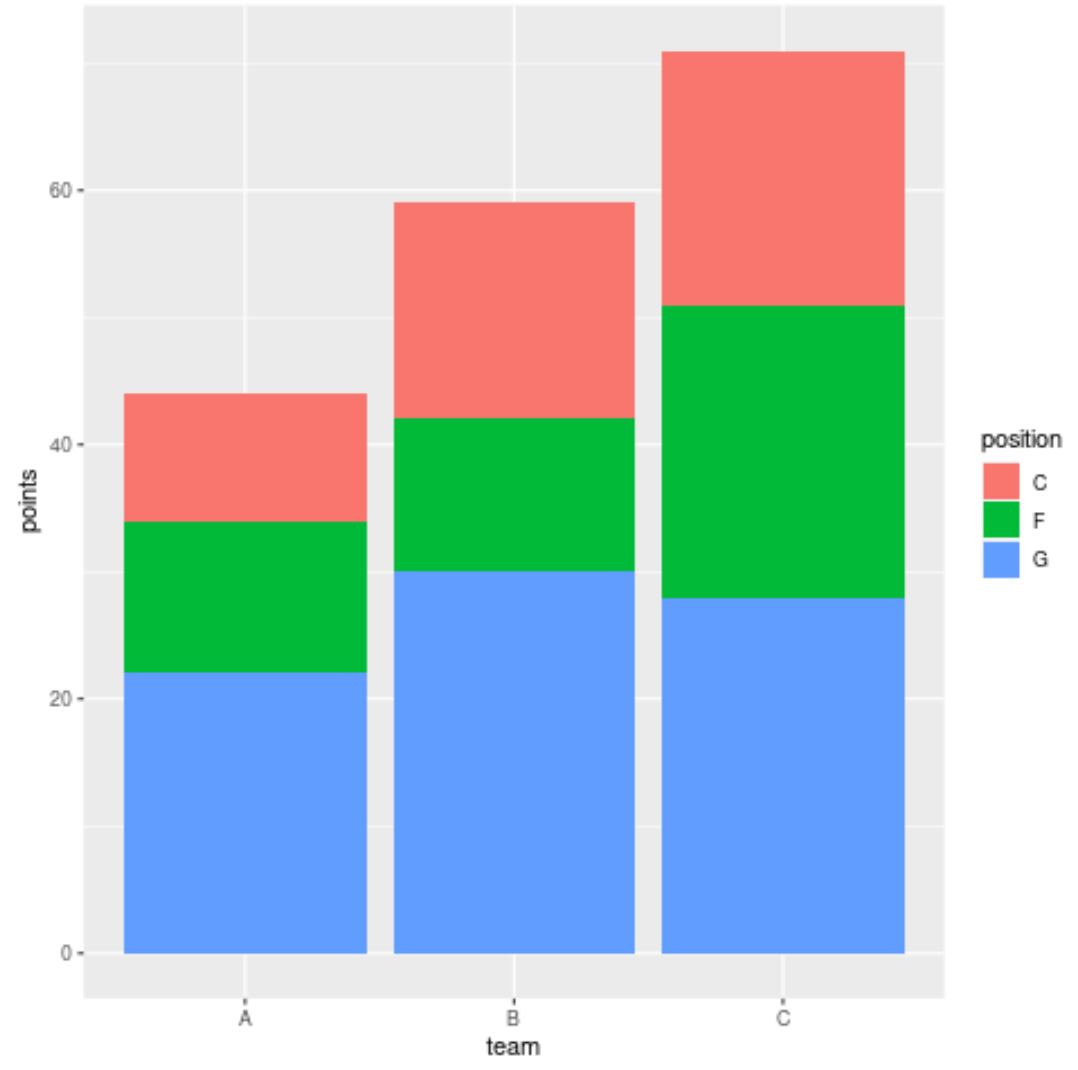
အဖွဲ့တစ်ခုစီရှိ ကစားသမားများမှ ရမှတ်များကို မြင်သာစေရန် တန်းစီထားသော ဘားဇယားကို ဖန်တီးပါက၊ ggplot2 သည် ဘားများကိုဖြည့ ်ရန် ပုံသေအရောင်အစုံကို အသုံးပြုပါမည်-
 library (ggplot2)

#create stacked bar chart
ggplot(df, aes(x=team, y=points, fill=position)) +
  geom_bar(position=' stack ', stat=' identity ')
သို့သော်လည်း၊ ဘားများအတွက် ggplot2 အသုံးပြုသင့်သည့် အရောင်အတိအကျကို သတ်မှတ်ရန် scale_fill_manual() အကြောင်းပြချက်ကို ကျွန်ုပ်တို့ အသုံးပြုနိုင်ပါသည်။
 library (ggplot2)

#create stacked bar chart with custom colors
ggplot(df, aes(x=team, y=points, fill=position)) +
  geom_bar(position=' stack ', stat=' identity ') +
  scale_fill_manual(values=c(' red ', ' purple ', ' pink '))
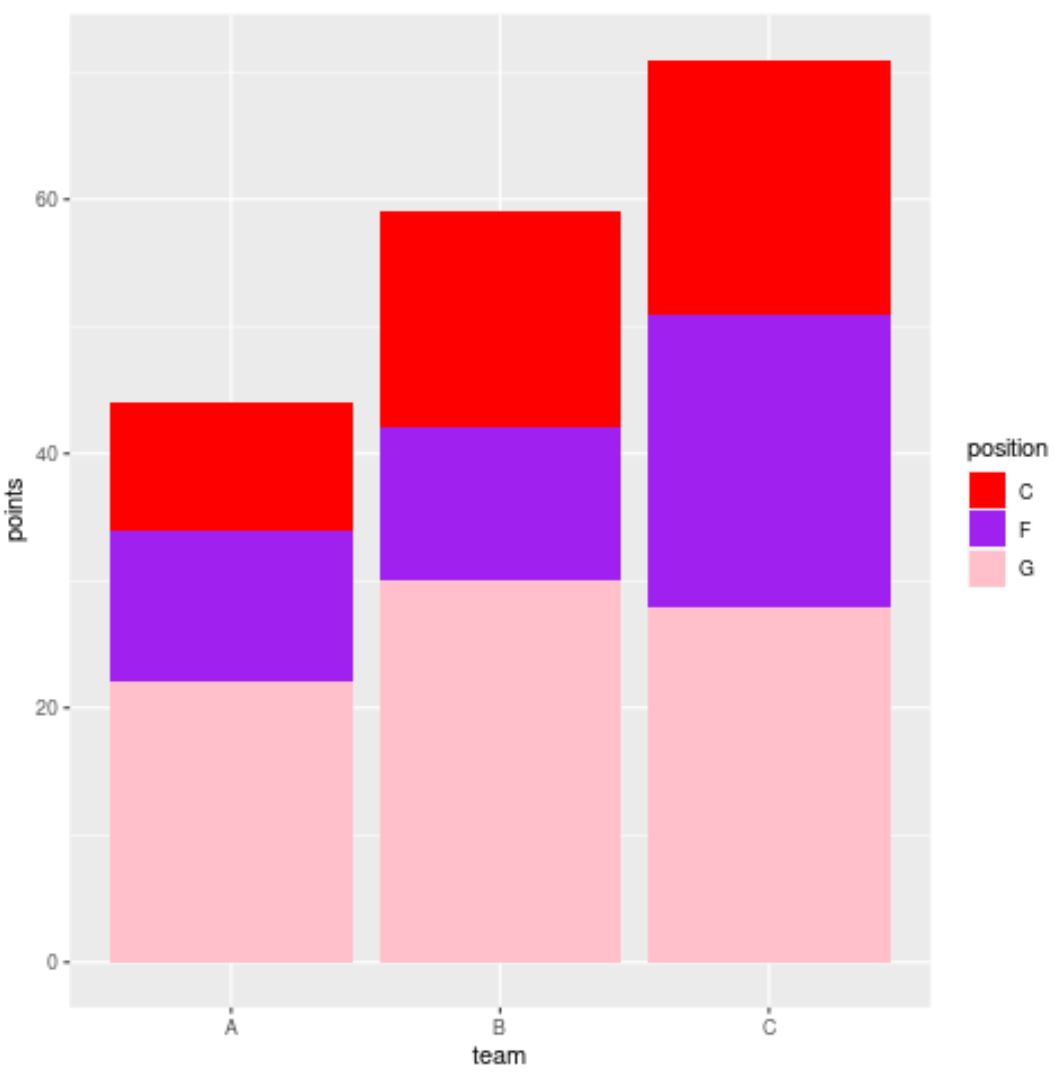
ယခုအခါ ဘားများသည် scale_fill_manual() လုပ်ဆောင်မှုတွင် ကျွန်ုပ်တို့သတ်မှတ်ထားသည့် အတိအကျအရောင်များ (အပေါ်မှအောက်ခြေသို့) ရှိနေပြီဖြစ်သည်။
scale_fill_manual() လုပ်ဆောင်ချက်တွင် ကျွန်ုပ်တို့သည် ဆဋ္ဌမကိန်းဂဏန်းအရောင်ကုဒ်များကို အသုံးပြုနိုင်ကြောင်းကိုလည်း သတိပြုပါ။
 library (ggplot2)

#create stacked bar chart with custom hex color codes
ggplot(df, aes(x=team, y=points, fill=position)) +
  geom_bar(position=' stack ', stat=' identity ') +
  scale_fill_manual(values=c(' #2596BE ', ' #8225BE ', ' #D4C443 '))
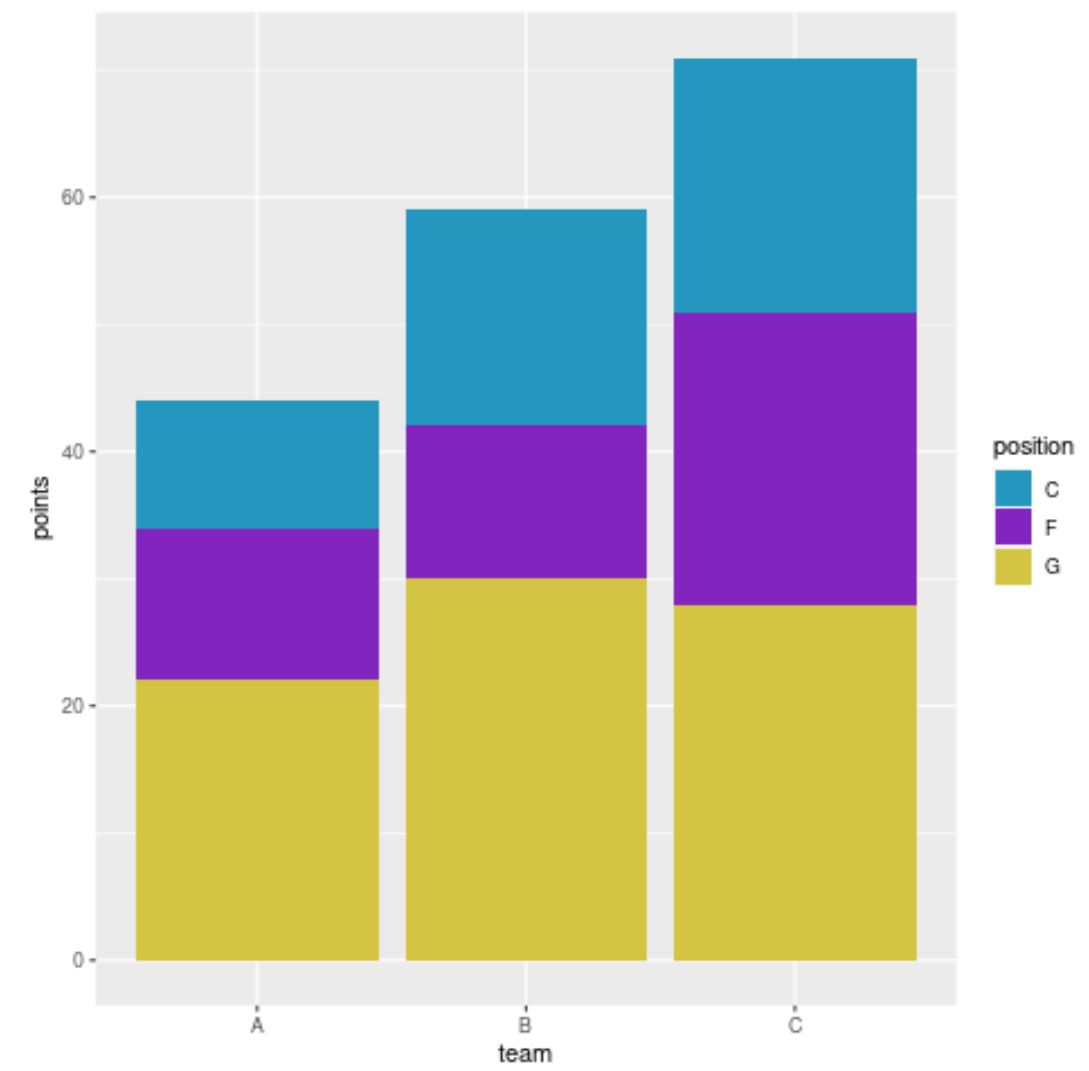
ယခုဘားများတွင် ကျွန်ုပ်တို့သတ်မှတ်ထားသော ဆယ်ဂဏန်းဂဏန်းရောင် ကုဒ်များရှိသည်။
ထပ်လောင်းအရင်းအမြစ်များ
အောက်ဖော်ပြပါ သင်ခန်းစာများသည် ggplot2 တွင် အခြားဘုံအလုပ်များကို မည်သို့လုပ်ဆောင်ရမည်ကို ရှင်းပြသည်-
ggplot2 ရှိ stacked bar chart တစ်ခုတွင် ဘားများကို ပြန်စီနည်း
အမျိုးမျိုးသော variable များဖြင့် ggplot2 တွင် Barplot ကိုဖန်တီးနည်း
ggplot2 ဘားဇယားတွင် ဘားများကို စီရန်
စာရေးသူအကြောင်း
Benjamin Anderson
မင်္ဂလာပါ၊ ကျွန်ုပ်သည် အငြိမ်းစား စာရင်းအင်း ပါမောက္ခ ဘင်ဂျမင်ဖြစ်ပြီး သီးသန့် Statorials ဆရာအဖြစ် လှည့်ပတ်ပါသည်။ စာရင်းဇယားနယ်ပယ်တွင် ကျယ်ပြန့်သောအတွေ့အကြုံနှင့် ကျွမ်းကျင်မှုနှင့်အတူ၊ Statorials မှတစ်ဆင့် ကျောင်းသားများကို ခွန်အားဖြစ်စေရန်အတွက် ကျွန်ုပ်၏အသိပညာကို မျှဝေလိုပါသည်။ ပိုသိတယ်။