Matplotlib တွင် ဝင်ရိုးကန့်သတ်ချက်များကို မည်သို့ရယူရမည်နည်း (ဥပမာနှင့်အတူ)
Matplotlib ရှိ ကွက်တစ်ခု၏ x နှင့် y axes အတွက် ဝင်ရိုးကန့်သတ်ချက်များကို ရယူရန် အောက်ပါ syntax ကို သင်အသုံးပြုနိုင်သည်-
 import matplotlib. pyplot as plt

#get x-axis and y-axis limits
xmin, xmax, ymin, ymax = plt. axis ()

#print axis limits
print (xmin, xmax, ymin, ymax)
အောက်ဖော်ပြပါ ဥပမာသည် ဤ syntax ကို လက်တွေ့တွင် မည်သို့အသုံးပြုရမည်ကို ပြသထားသည်။
ဥပမာ- Matplotlib တွင် ဝင်ရိုးကန့်သတ်ချက်များကို မည်သို့ရယူရမည်နည်း။
Matplotlib တွင် အောက်ပါ scatterplot ကို ဖန်တီးသည်ဆိုပါစို့။
 import matplotlib. pyplot as plt

#define x and y
x = [1, 2, 3, 4, 5, 6, 7, 8, 9, 10]
y = [1, 5, 9, 15, 24, 39, 35, 35, 40, 41]

#create scatter plot of x vs. y
plt. scatter (x,y)
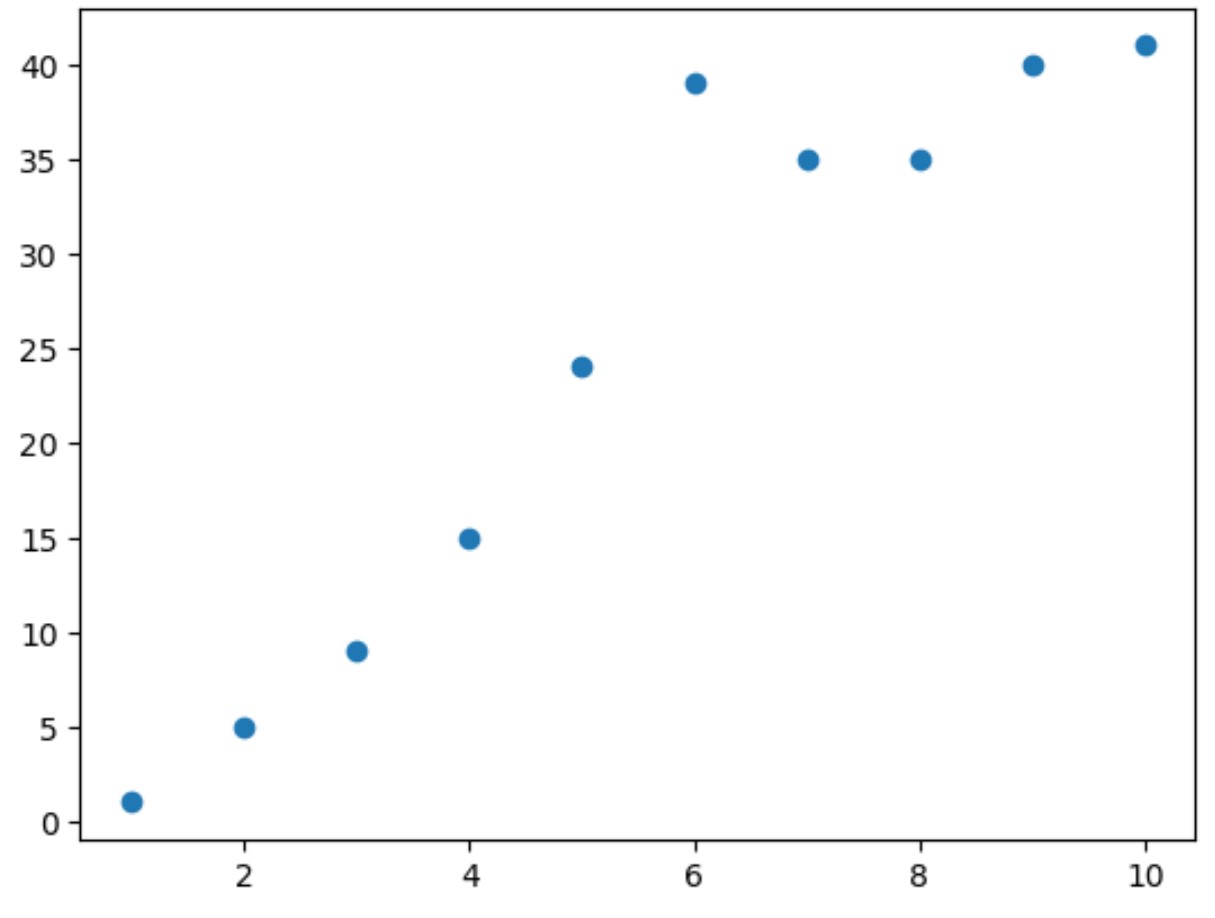
scatterplot ၏ x နှင့် y axes အတွက် ဝင်ရိုးကန့်သတ်ချက်များကို ရယူရန် အောက်ပါ syntax ကို အသုံးပြုနိုင်ပါသည်။
 import matplotlib. pyplot as plt

#define x and y
x = [1, 2, 3, 4, 5, 6, 7, 8, 9, 10]
y = [1, 5, 9, 15, 24, 39, 35, 35, 40, 41]

#create scatter plot of x vs. y
plt. scatter (x,y)

#get x-axis and y-axis limits
xmin, xmax, ymin, ymax = plt. axis ()

#print axis limits
print (xmin, xmax, ymin, ymax)

0.55 10.45 -1.0 43.0
ရလဒ်မှ ကျွန်ုပ်တို့ မြင်နိုင်သည်-
- x-axis တွင် အနည်းဆုံး- 0.55
- x-axis တွင် အများဆုံး- 10.45
- y ဝင်ရိုးတွင် အနည်းဆုံး- -1.0
- y-ဝင်ရိုးတွင် အများဆုံး- 43.0
ဤတန်ဖိုးများသည် အပေါ်က scatterplot တွင်မြင်ရသော ဝင်ရိုးကန့်သတ်ချက်များနှင့် ကိုက်ညီပါသည်။
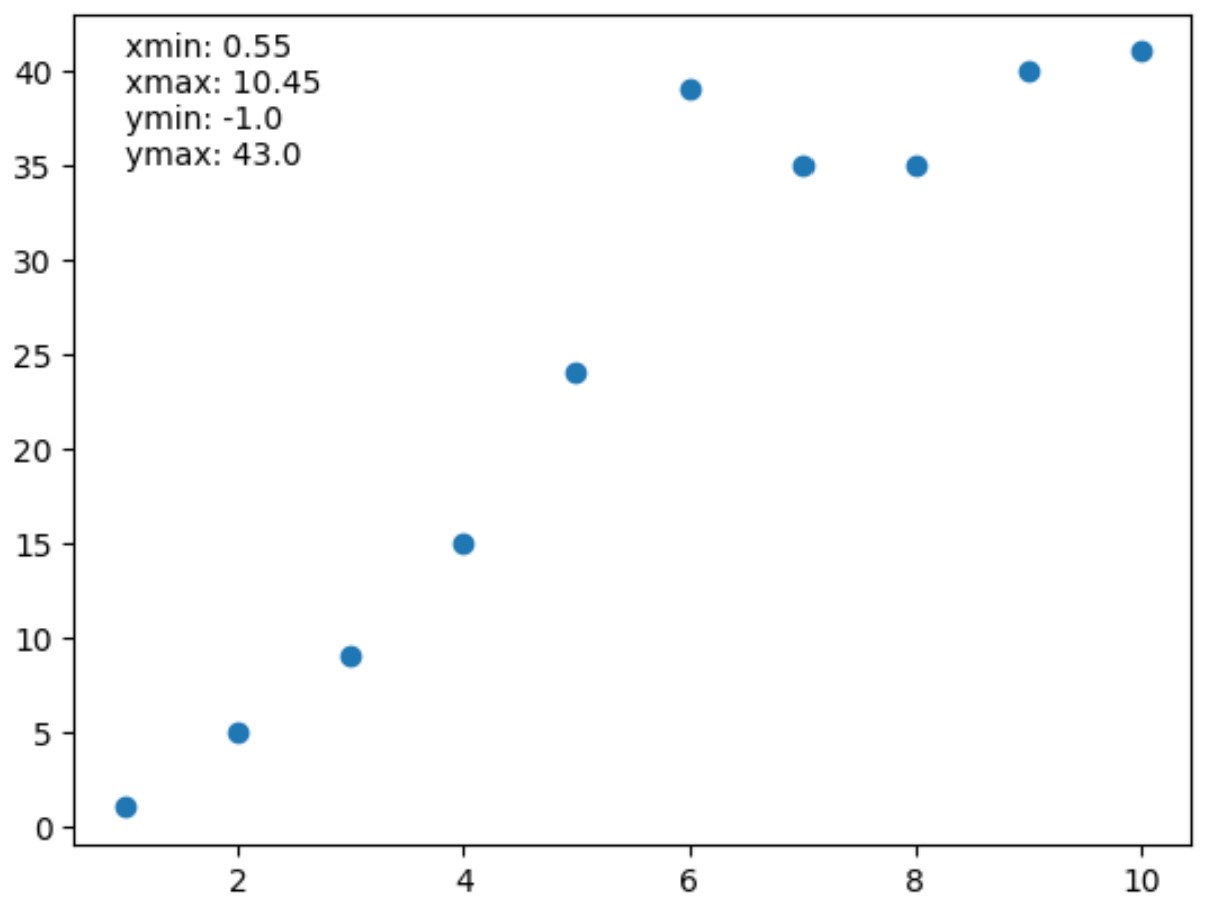
ကျွန်ုပ်တို့အလိုရှိပါက ကွက်ကွက်တွင် ဤဝင်ရိုးကန့်သတ်ချက်များကို စာသားတန်ဖိုးများအဖြစ် ထည့်ရန် annotate() လုပ်ဆောင်ချက်ကိုလည်း အသုံးပြုနိုင်သည်။
 import matplotlib. pyplot as plt

#define x and y
x = [1, 2, 3, 4, 5, 6, 7, 8, 9, 10]
y = [1, 5, 9, 15, 24, 39, 35, 35, 40, 41]

#create scatter plot of x vs. y
plt. scatter (x,y)

#get x-axis and y-axis limits
xmin, xmax, ymin, ymax = plt. axis ()

#print axis limits
lims = ' xmin: ' + str(round(xmin, 2 )) + ' \n ' + \
       ' xmax: ' + str(round(xmax, 2 )) + ' \n ' + \
       ' ymin: ' + str(round(ymin, 2 )) + ' \n ' + \
       ' ymax: ' + str(round(ymax, 2 ))

#add axis limits to plot at (x,y) coordinate (1.35)
plt. annotate (lims, ( 1 , 35 ))
ထပ်လောင်းအရင်းအမြစ်များ
အောက်ပါသင်ခန်းစာများသည် Matplotlib ရှိ အခြားဘုံအလုပ်များကို မည်သို့လုပ်ဆောင်ရမည်ကို ရှင်းပြသည်-
Matplotlib တွင် ဝင်ရိုးအမှန်ခြစ်များ သတ်မှတ်နည်း
Matplotlib တွင် ကွက်ကွက်အရွယ်အစားကို မည်သို့တိုးမည်နည်း။
Matplotlib ကွက်များသို့ စာသားထည့်နည်း
စာရေးသူအကြောင်း
Benjamin Anderson
မင်္ဂလာပါ၊ ကျွန်ုပ်သည် အငြိမ်းစား စာရင်းအင်း ပါမောက္ခ ဘင်ဂျမင်ဖြစ်ပြီး သီးသန့် Statorials ဆရာအဖြစ် လှည့်ပတ်ပါသည်။ စာရင်းဇယားနယ်ပယ်တွင် ကျယ်ပြန့်သောအတွေ့အကြုံနှင့် ကျွမ်းကျင်မှုနှင့်အတူ၊ Statorials မှတစ်ဆင့် ကျောင်းသားများကို ခွန်အားဖြစ်စေရန်အတွက် ကျွန်ုပ်၏အသိပညာကို မျှဝေလိုပါသည်။ ပိုသိတယ်။