Matplotlib တွင် အလျားလိုက်ဇယားကွက်တစ်ခုသာဆွဲနည်း
Matplotlib တွင် အလျားလိုက်ဂရစ်တစ်ခုသာဆွဲရန် အောက်ပါအခြေခံအထားအသိုကိုသုံးနိုင်သည်။
ax. grid (axis=' y ')
အောက်ဖော်ပြပါ ဥပမာသည် ဤ syntax ကို လက်တွေ့တွင် မည်သို့အသုံးပြုရမည်ကို ပြသထားသည်။
ဥပမာ- Matplotlib တွင် အလျားလိုက်ဇယားကွက်တစ်ခုသာဆွဲပါ။
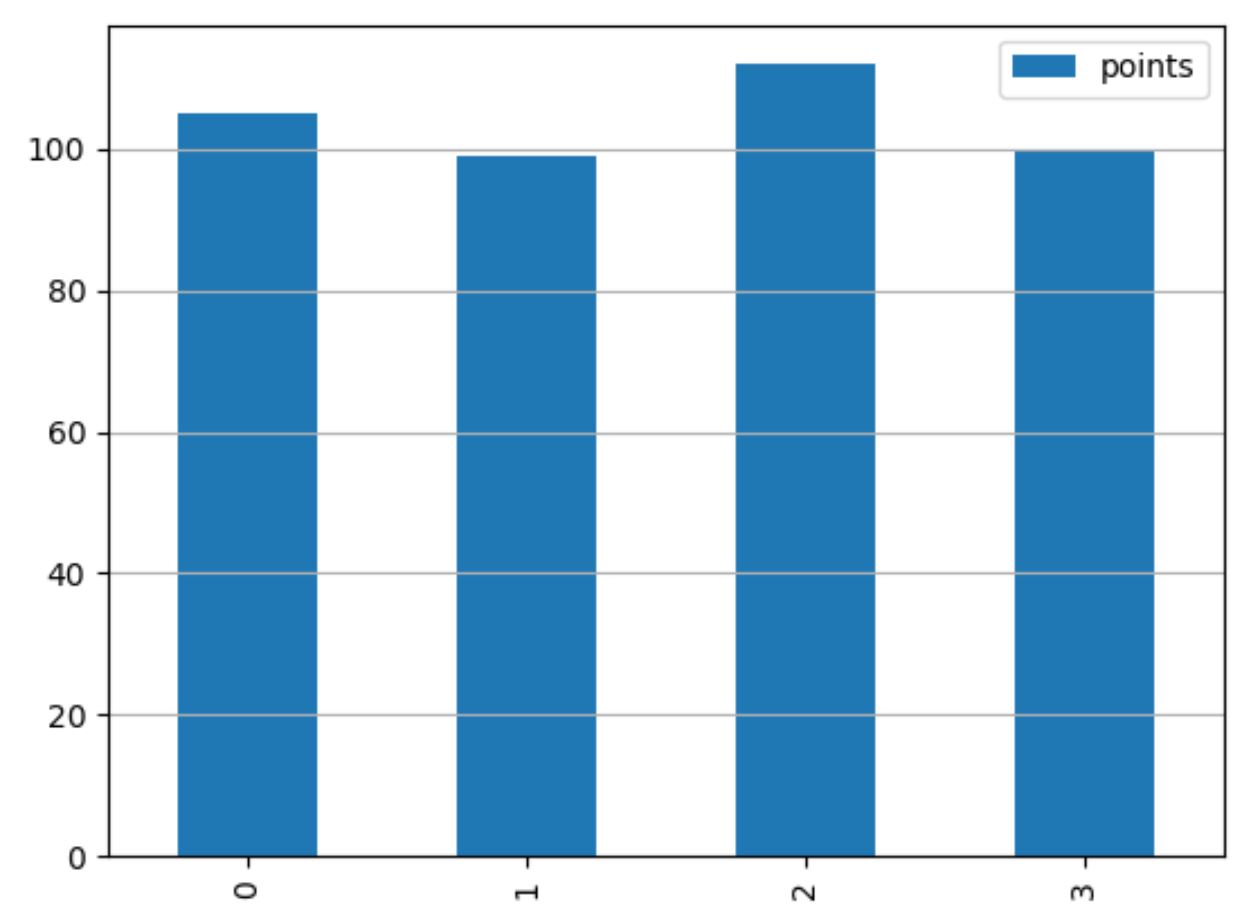
အောက်ဖော်ပြပါကုဒ်သည် ကွက်ကွက်တွင် အလျားလိုက်ဂရစ်တစ်ခုဖြင့် Matplotlib တွင် ဘားကွက်တစ်ခုဖန်တီးနည်းကို ပြသသည်-
 import pandas as pd
import matplotlib. pyplot as plt

#createDataFrame
df = pd. DataFrame ({' team ':['Mavs', 'Nets', 'Spurs', 'Warriors'],
                   ' points ':[105, 99, 112, 100]})

#defineplot
fig, ax = plt. subplots ()

#create bar plot
df. plot (kind=' bar ', ax=ax)

#add horizontal gridlines
ax. grid (axis=' y ')

#displayplot
plt. show ()
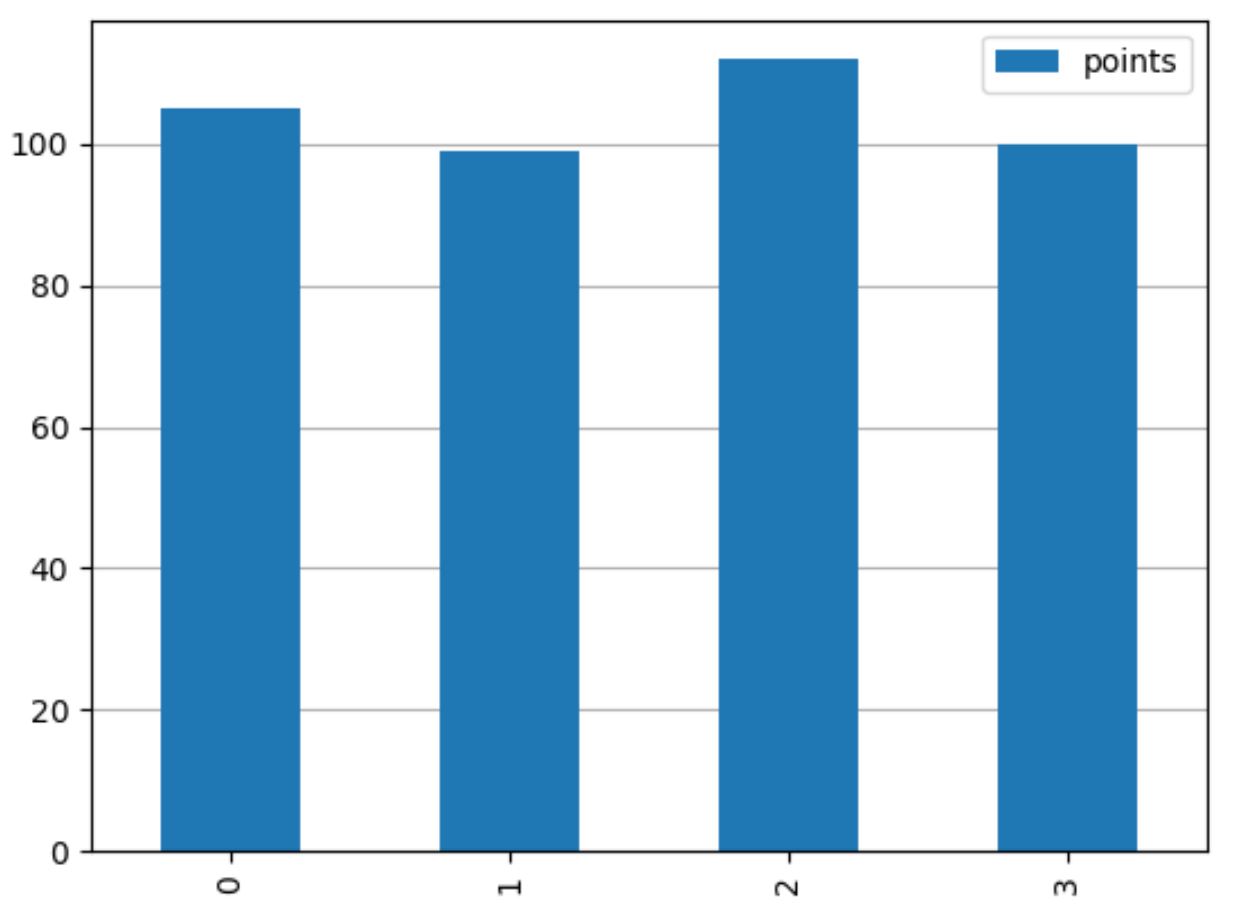
ဇာတ်ကွက်ရှိဘားများ၏နောက်ကွယ်ရှိအလျားလိုက်ဂရစ်လိုင်းကိုပြသရန် ax.set_axisbelow(True) ကို လွတ်လပ်စွာအသုံးပြုပါ။
 import pandas as pd
import matplotlib. pyplot as plt

#createDataFrame
df = pd. DataFrame ({' team ':['Mavs', 'Nets', 'Spurs', 'Warriors'],
                   ' points ':[105, 99, 112, 100]})

#defineplot
fig, ax = plt. subplots ()

#create bar plot
df. plot (kind=' bar ', ax=ax)

#add horizontal gridlines behind bars in the plot
ax. set_axisbelow ( True )
ax. grid (axis=' y ')

#displayplot
plt. show ()
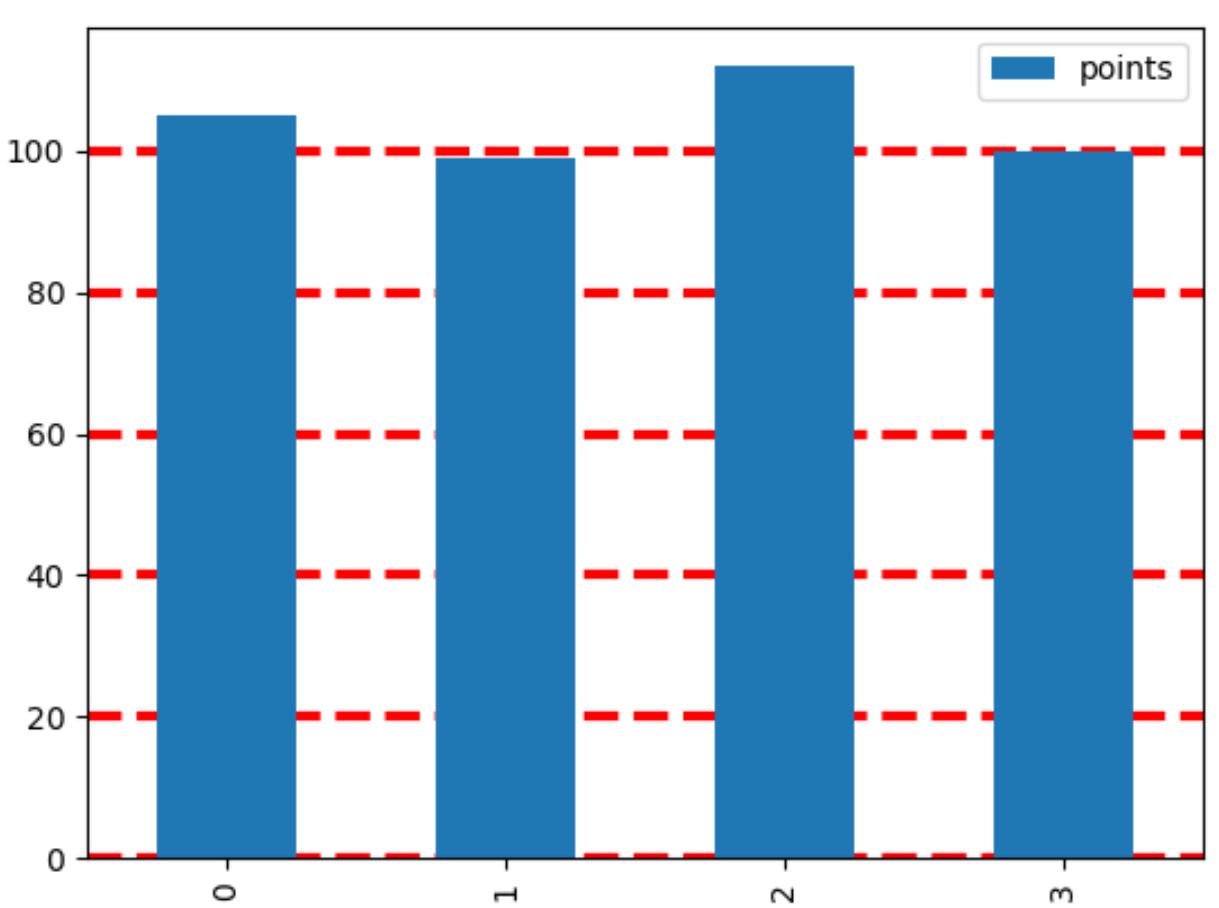
ဂရစ်၏အသွင်အပြင်ကို စိတ်ကြိုက်ပြင်ဆင်ရန် grid() လုပ်ဆောင်ချက်ရှိ အရောင် ၊ လိုင်းပုံစံ နှင့် linewidth အငြင်းအခုံများကို လွတ်လပ်စွာသုံးနိုင်သည်-
 import pandas as pd
import matplotlib. pyplot as plt

#createDataFrame
df = pd. DataFrame ({' team ':['Mavs', 'Nets', 'Spurs', 'Warriors'],
                   ' points ':[105, 99, 112, 100]})

#defineplot
fig, ax = plt. subplots ()

#create bar plot
df. plot (kind=' bar ', ax=ax)

#add horizontal gridlines with custom appearance
ax. set_axisbelow ( True )
ax. grid (axis=' y ', color=' red ', linestyle=' dashed ', linewidth= 3 )

#displayplot
plt. show ()
Matplotlib documentation တွင် gridlines များကို စိတ်ကြိုက်ပြင်ဆင်ရန် နည်းလမ်းအပြည့်အစုံကို သင်တွေ့နိုင်သည်။
ထပ်လောင်းအရင်းအမြစ်များ
အောက်ပါသင်ခန်းစာများသည် Matplotlib ရှိ အခြားဘုံအလုပ်များကို မည်သို့လုပ်ဆောင်ရမည်ကို ရှင်းပြသည်-
Matplotlib ကွက်များမှ tick များကိုမည်သို့ဖယ်ရှားနည်း
Matplotlib ကွက်တွင် ဖောင့်အရွယ်အစားကို မည်သို့ပြောင်းလဲမည်နည်း။
Matplotlib တွင် ပျမ်းမျှမျဉ်းကြောင်းထည့်နည်း
စာရေးသူအကြောင်း
Benjamin Anderson
မင်္ဂလာပါ၊ ကျွန်ုပ်သည် အငြိမ်းစား စာရင်းအင်း ပါမောက္ခ ဘင်ဂျမင်ဖြစ်ပြီး သီးသန့် Statorials ဆရာအဖြစ် လှည့်ပတ်ပါသည်။ စာရင်းဇယားနယ်ပယ်တွင် ကျယ်ပြန့်သောအတွေ့အကြုံနှင့် ကျွမ်းကျင်မှုနှင့်အတူ၊ Statorials မှတစ်ဆင့် ကျောင်းသားများကို ခွန်အားဖြစ်စေရန်အတွက် ကျွန်ုပ်၏အသိပညာကို မျှဝေလိုပါသည်။ ပိုသိတယ်။