Matplotlib အပိုင်းအစများကို မှတ်သားနည်း
Matplotlib ရှိ scatterplot များကို မှတ်သားထားရန် အောက်ပါ အခြေခံ syntax ကို သင် အသုံးပြုနိုင်ပါသည်။
 #add 'my text' at (x, y) coordinates = (6, 9.5)
plt. text (6, 9.5, ' my text ')
အောက်ပါဥပမာများသည် ဤ syntax ကိုလက်တွေ့တွင်မည်သို့အသုံးပြုရမည်ကိုပြသထားသည်။
အခြေခံအချက် cloud ဖန်တီးပါ။
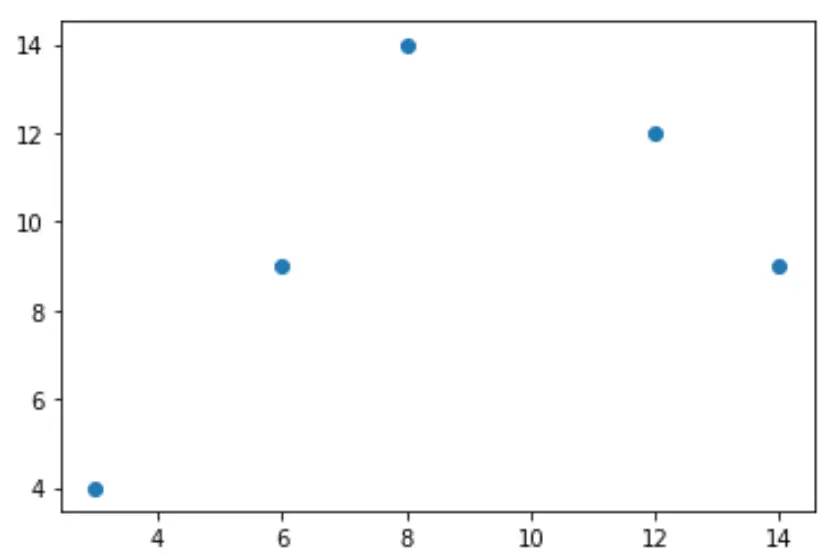
အောက်ပါကုဒ်သည် Matplotlib ကို အသုံးပြု၍ အခြေခံ scatterplot ဖန်တီးနည်းကို ပြသသည် ။
 import matplotlib.pyplot as plt

#createdata
x = [3, 6, 8, 12, 14]
y = [4, 9, 14, 12, 9]

#create scatterplot
plt. scatter (x,y)
အချက်တစ်ချက်ကို မှတ်သားပါ။
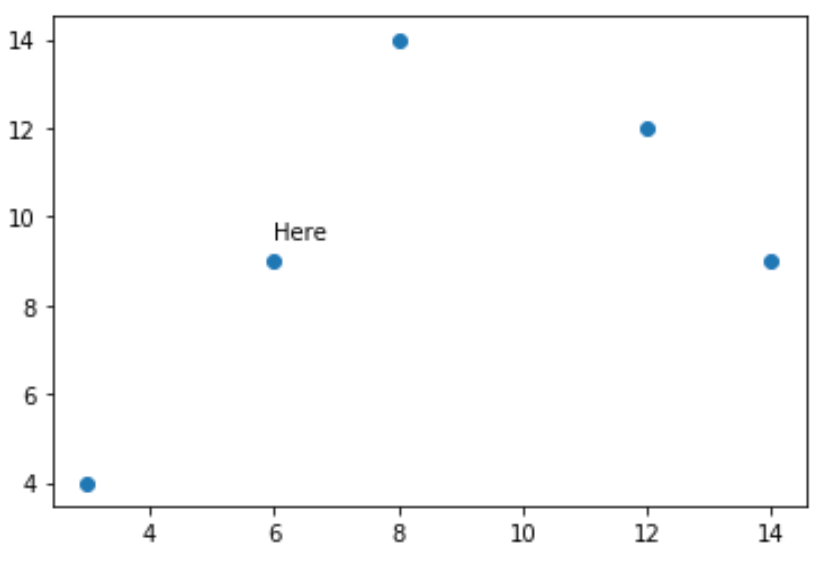
ကွက်ကွက်ပေါ်ရှိ အမှတ်တစ်ခုတည်းသို့ မှတ်စာတစ်ခုထည့်ရန် အောက်ပါကုဒ်ကို အသုံးပြုနိုင်သည်။
 import matplotlib.pyplot as plt

#create data
x = [3, 6, 8, 12, 14]
y = [4, 9, 14, 12, 9]

#create scatterplot
plt. scatter (x,y)

#add text 'Here' at (x, y) coordinates = (6, 9.5)
plt. text (6, 9.5, ' Here ')
အချက်များစွာကို မှတ်သားပါ။
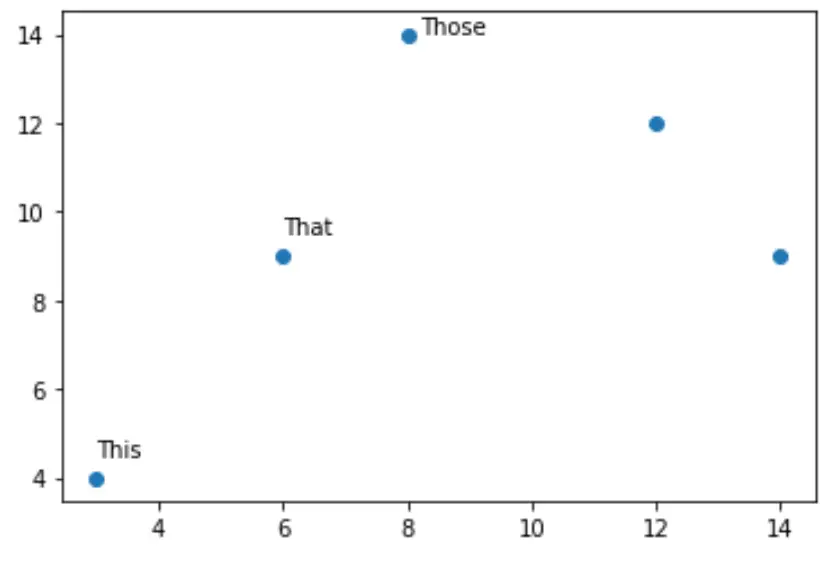
ဇာတ်ကွက်ပေါ်ရှိ အမှတ်များစွာအတွက် မှတ်ချက်များကို ထည့်ရန် အောက်ပါကုဒ်ကို အသုံးပြုနိုင်သည်။
 import matplotlib.pyplot as plt

#create data
x = [3, 6, 8, 12, 14]
y = [4, 9, 14, 12, 9]

#create scatterplot
plt. scatter (x,y)

#add text to certain points
plt. text (3, 4.5, ' This ')
plt. text (6, 9.5, ' That ')
plt. text (8.2, 14, ' Those ')
အချက်အားလုံးကို မှတ်သားထားပါ။
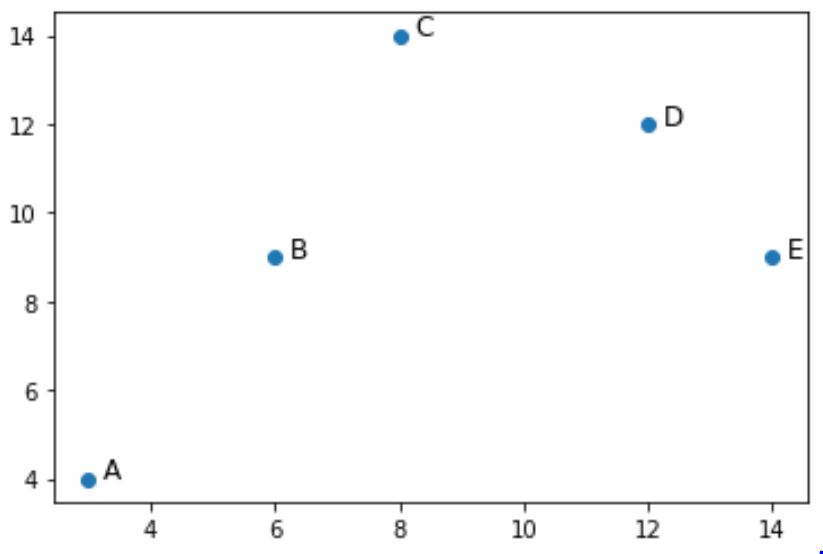
ကွက်လပ်ပေါ်ရှိ အမှတ်တစ်ခုစီတွင် မှတ်ချက်များကို ထည့်ရန် အောက်ပါကုဒ်ကို အသုံးပြုနိုင်သည်။
 import matplotlib.pyplot as plt

#createdata
x = [3, 6, 8, 12, 14]
y = [4, 9, 14, 12, 9]
labs = ['A', 'B', 'C', 'D', 'E']

#create scatterplot
plt. scatter (x,y)

#use for loop to add annotations to each point in plot
for i, txt in enumerate(labs):
    plt. annotate (txt, (x[ i ], y[ i ]))
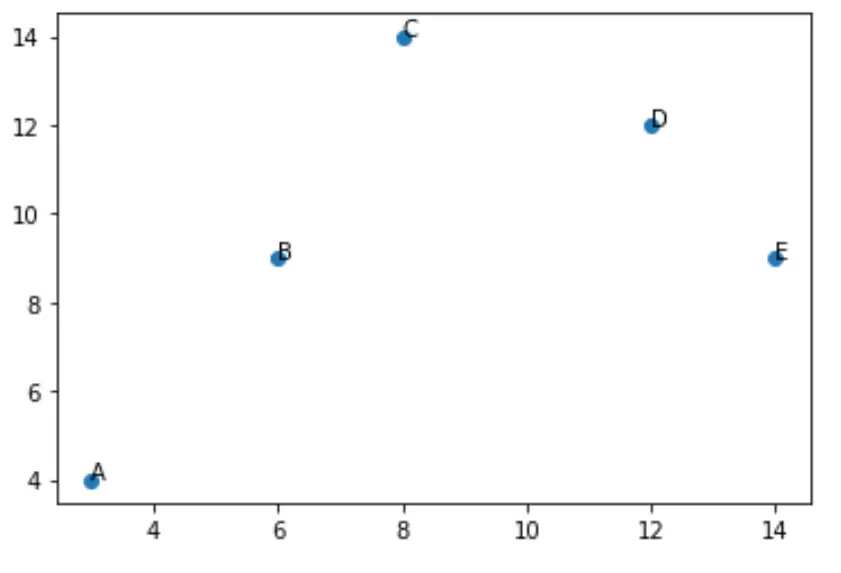
ပုံသေအားဖြင့်၊ မှတ်ချက်များကို အမှတ်အသားပြုသည့် cloud ရှိ အမှတ်များအထက်တွင် တိုက်ရိုက်ထားရှိမည်ဖြစ်ပြီး ပုံသေဖောင့်အရွယ်အစားမှာ 10 ဖြစ်သည်။
အောက်ဖော်ပြပါ ကုဒ်သည် မှတ်ချက်များကို အမှတ်များ၏ ညာဘက်သို့ အနည်းငယ် ရှိပြီး ဖောင့်အရွယ်အစား အနည်းငယ် ပိုကြီးစေရန် ဤဆက်တင်နှစ်ခုကို ချိန်ညှိနည်းကို ပြသသည်-
 import matplotlib.pyplot as plt

#create data
x = [3, 6, 8, 12, 14]
y = [4, 9, 14, 12, 9]
labs = ['A', 'B', 'C', 'D', 'E']

#create scatterplot
plt. scatter (x,y)

#use for loop to add annotations to each point in plot
for i, txt in enumerate(labs):
    plt. annotate (txt, (x[ i ]+.25, y[ i ]), fontsize=12)
ထပ်လောင်းအရင်းအမြစ်များ
အောက်ပါသင်ခန်းစာများသည် Matplotlib ရှိ အခြားဘုံအလုပ်များကို မည်သို့လုပ်ဆောင်ရမည်ကို ရှင်းပြသည်-
Matplotlib တွင် scatterplot သို့ ဒဏ္ဍာရီထည့်နည်း
Matplotlib ရှိ တန်ဖိုးအလိုက် အပိုင်းအစတစ်ခုကို အရောင်ခြယ်နည်း
Matplotlib ရှိ မြေကွက်များသို့ ပျမ်းမျှမျဉ်းကြောင်းထည့်နည်း
စာရေးသူအကြောင်း
Benjamin Anderson
မင်္ဂလာပါ၊ ကျွန်ုပ်သည် အငြိမ်းစား စာရင်းအင်း ပါမောက္ခ ဘင်ဂျမင်ဖြစ်ပြီး သီးသန့် Statorials ဆရာအဖြစ် လှည့်ပတ်ပါသည်။ စာရင်းဇယားနယ်ပယ်တွင် ကျယ်ပြန့်သောအတွေ့အကြုံနှင့် ကျွမ်းကျင်မှုနှင့်အတူ၊ Statorials မှတစ်ဆင့် ကျောင်းသားများကို ခွန်အားဖြစ်စေရန်အတွက် ကျွန်ုပ်၏အသိပညာကို မျှဝေလိုပါသည်။ ပိုသိတယ်။