Pandas တွင် ပြုပြင်နည်း- typeerror- ကြံစည်ရန် ကိန်းဂဏာန်းဒေတာမရှိပါ။
ပန်ဒါများကို အသုံးပြုရာတွင် သင်ကြုံတွေ့ရနိုင်သည့် အမှားတစ်ခုမှာ-
TypeError : no numeric data to plot
pandas DataFrame မှ တန်ဖိုးများကို ကြံစည်ရန် ကြိုးပမ်းသောအခါတွင် ဤအမှားသည် ဖြစ်ပေါ်လာသည်၊ သို့သော် ကြံစည်ရန် ကိန်းဂဏာန်းတန်ဖိုးများ မရှိပါ။
DataFrame ရှိ ကော်လံတစ်ခုသည် ကိန်းဂဏာန်းဖြစ်သည်ဟု သင်ထင်သောအခါတွင် ဤအမှားသည် များသောအားဖြင့် ဖြစ်ပေါ်တတ်သည်၊ သို့သော် ၎င်းသည် မတူညီသော ဒေတာအမျိုးအစားတစ်ခု ဖြစ်လာသည်။
အောက်ဖော်ပြပါ ဥပမာသည် ဤအမှားကို လက်တွေ့တွင် မည်သို့ပြုပြင်ရမည်ကို ပြသထားသည်။
အမှားကို ဘယ်လိုပြန်ထုတ်မလဲ။
ကျွန်ုပ်တို့တွင် အောက်ပါ ပန်ဒါ DataFrame ရှိသည် ဆိုပါစို့။
 import pandas as pd

#createDataFrame
df = pd. DataFrame ({' team ': ['A', 'A', 'B', 'B', 'B'],
                   ' points ': ['5', '7', '7', '9', '12'],
                   ' rebounds ': ['11', '8', '10', '6', '6'],
                   ' blocks ': ['4', '7', '7', '6', '5']})

#view DataFrame
df

	team points rebound blocks
0 A 5 11 4
1 To 7 8 7
2 B 7 10 7
3 B 9 6 6
4 B 12 6 5
ယခု ကျွန်ုပ်တို့သည် ကိန်းဂဏာန်းများဟု ကျွန်ုပ်တို့ထင်မြင်သော ကိန်းရှင်သုံးခုအတွက် မျဉ်းကြောင်းကွက်ကွက်တစ်ခုကို ဖန်တီးရန် ကြိုးစားသည်ဆိုပါစို့။
 #attempt to create line plot for points, rebounds, and blocks
df[[' points ', ' rebounds ', ' blocks ']]. plot ()

ValueError : no numeric data to plot
ဤကော်လံများအနက်မှ အမှန်တကယ် ကိန်းဂဏာန်းမရှိသောကြောင့် ကျွန်ုပ်တို့ အမှားအယွင်းတစ်ခု ဖြစ်ပေါ်နေပါသည်။
အမှားကိုဘယ်လိုပြင်မလဲ။
ကျွန်ုပ်တို့၏ DataFrame တွင် ကော်လံတစ်ခုစီမှ ဒေတာအမျိုးအစားကို ကြည့်ရန် dtypes လုပ်ဆောင်ချက်ကို ကျွန်ုပ်တို့အသုံးပြုနိုင်သည်-
 #display data type of each column in DataFrame
df. dtypes

team object
points object
rebound object
blocks object
dtype:object
DataFrame အတွင်းရှိ ကော်လံတစ်ခုမှ ဂဏန်းများမဟုတ်ကြောင်း ကျွန်ုပ်တို့တွေ့မြင်နိုင်ပါသည်။
သတ်မှတ်ထားသောကော်လံများကို ဂဏန်းတန်ဖိုးများအဖြစ် ပြောင်းလဲရန် .astype() လုပ်ဆောင်ချက်ကို ကျွန်ုပ်တို့အသုံးပြုနိုင်သည်-
 #convert points, rebounds, and blocks columns to numeric
df[' points ']=df[' points ']. astype (float)
df[' rebounds ']=df[' rebounds ']. astype (float)
df[' blocks ']=df[' blocks ']. astype (float)
ထို့နောက် plot() function ကို ပြန်သုံးနိုင်သည်-
 #create line plot for points, rebounds, and blocks
df[[' points ', ' rebounds ', ' blocks ']]. plot ()
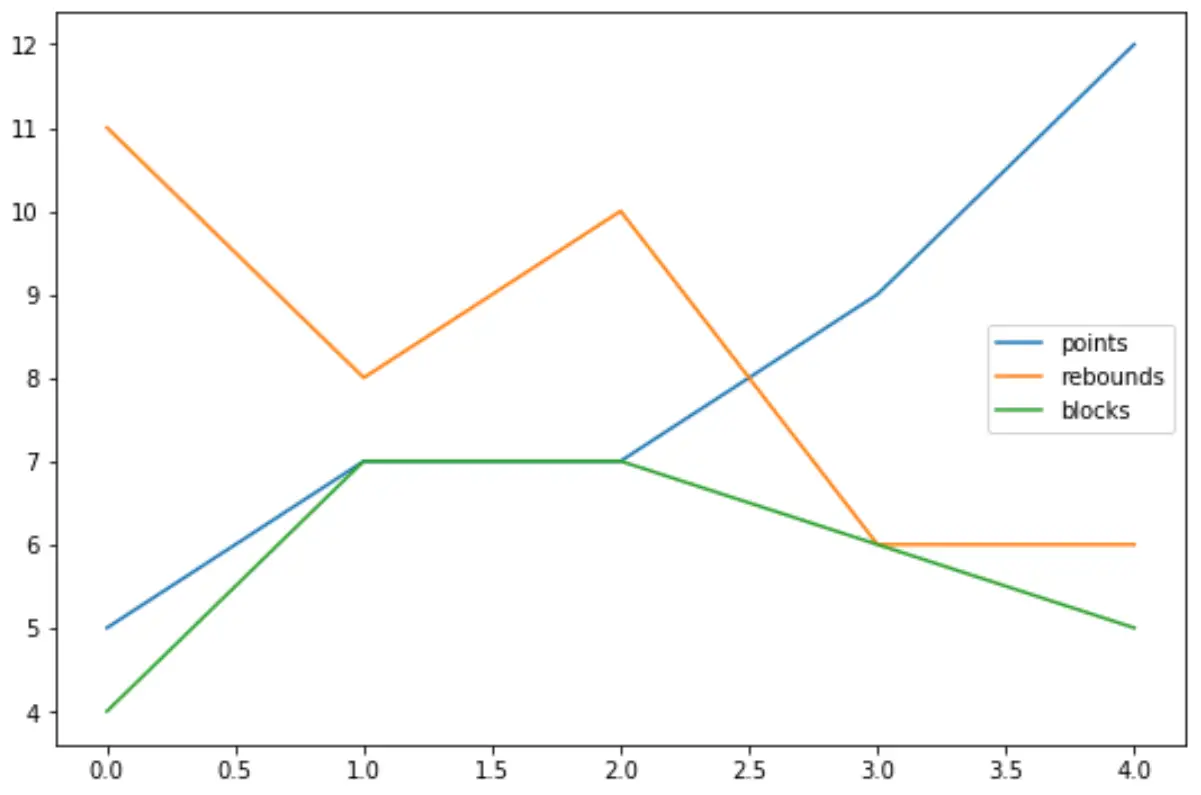
ကိန်းရှင်တစ်ခုစီသည် ယခုအခါ ကိန်းဂဏာန်းဖြစ်သောကြောင့် အမှတ်များ၊ အကွက်များနှင့် ဘလောက်များအတွက် မျဉ်းကြောင်းကွက်ကွက်တစ်ခုကို အောင်မြင်စွာဖန်တီးနိုင်ပါပြီ။
dtypes လုပ်ဆောင်ချက်ကို အသုံးပြု၍ ၎င်းကို ထပ်မံစစ်ဆေးနိုင်သည်-
 #display data type of each column in DataFrame
df. dtypes

team object
float64 points
rebounds float64
blocks float64
dtype:object
ထပ်လောင်းအရင်းအမြစ်များ
အောက်ဖော်ပြပါ သင်ခန်းစာများသည် Python ရှိ အခြားသော ဘုံအမှားများကို မည်သို့ပြင်ဆင်ရမည်ကို ရှင်းပြသည်-
Pandas တွင် KeyError ကိုဘယ်လိုပြင်မလဲ။
ပြင်ဆင်နည်း- ValueError- float NaN ကို int အဖြစ်သို့ ပြောင်းလဲ၍မရပါ။
ပြုပြင်နည်း- တန်ဖိုးအမှား- Operands များကို ပုံသဏ္ဍာန်များဖြင့် ထုတ်လွှင့်၍မရပါ။
စာရေးသူအကြောင်း
Benjamin Anderson
မင်္ဂလာပါ၊ ကျွန်ုပ်သည် အငြိမ်းစား စာရင်းအင်း ပါမောက္ခ ဘင်ဂျမင်ဖြစ်ပြီး သီးသန့် Statorials ဆရာအဖြစ် လှည့်ပတ်ပါသည်။ စာရင်းဇယားနယ်ပယ်တွင် ကျယ်ပြန့်သောအတွေ့အကြုံနှင့် ကျွမ်းကျင်မှုနှင့်အတူ၊ Statorials မှတစ်ဆင့် ကျောင်းသားများကို ခွန်အားဖြစ်စေရန်အတွက် ကျွန်ုပ်၏အသိပညာကို မျှဝေလိုပါသည်။ ပိုသိတယ်။