R: plot.new ကို ဘယ်လိုပြင်ရမလဲဆိုတာ မခေါ်သေးပါဘူး။
R ကိုအသုံးပြုရာတွင် သင်ကြုံတွေ့ရနိုင်သည့် အမှားတစ်ခုမှာ-
 Error in plot.xy(xy.coords(x, y), type = type, ...):
  plot.new has not been called yet
R တွင် ရှိနှင့်ပြီးသား ကွက်ကွက်တစ်ခု လိုအပ်သည့် လုပ်ဆောင်ချက်တစ်ခုကို လုပ်ဆောင်ရန် ကြိုးပမ်းသောအခါတွင် ဤအမှားသည် ဖြစ်ပေါ်လာသည်၊ သို့သော် ကြံစည်မှု မရှိပါ။
အောက်ဖော်ပြပါ ဥပမာများသည် ဤအမှားကို လက်တွေ့တွင် မည်သို့ပြုပြင်ရမည်ကို ပြသထားသည်။
ဥပမာ 1- လိုင်း() ဖြင့် အမှားကို ဘယ်လိုပြင်ရမလဲ။
R တွင် တပ်ဆင်ထားသော ဆုတ်ယုတ်မှုမျဉ်းကို ရေးဆွဲရန် ကြိုးစားနေသည် ဆိုပါစို့။
 #createdata
df <- data. frame (x=c(1, 2, 2, 3, 5, 6, 8, 8, 9, 9, 10, 11, 12, 15, 15),
                 y=c(2, 3, 3, 4, 5, 5, 6, 7, 8, 8, 9, 10, 16, 19, 28))

#fit polynomial regression model
model <- lm(y~poly(x, 2), data=df)

#define new sequence of x-values
new_x <- seq(min(df$x), max(df$y))

#attempt to plot fitted regression line
lines(new_x, predict(model, newdata = data. frame (x=new_x)))

Error in plot.xy(xy.coords(x, y), type = type, ...):
  plot.new has not been called yet
R တွင် လမ်းကြောင်းတစ်ခုကို ဦးစွာမဖန်တီးဘဲ လိုင်း() လုပ်ဆောင်ချက်ကို အသုံးမပြုနိုင်သောကြောင့် ကျွန်ုပ်တို့သည် အမှားအယွင်းတစ်ခုကို လက်ခံရရှိနေပါသည်။
ဤအမှားကိုပြင်ရန်၊ ကျွန်ုပ်တို့သည် ဦးစွာ scatter plot တစ်ခုကို ဖန်တီးပြီးနောက် လိုင်း() လုပ်ဆောင်ချက်ကို အသုံးပြုနိုင်ပါသည်။
 #create data
df <- data. frame (x=c(1, 2, 2, 3, 5, 6, 8, 8, 9, 9, 10, 11, 12, 15, 15),
                 y=c(2, 3, 3, 4, 5, 5, 6, 7, 8, 8, 9, 10, 16, 19, 28))

#fit polynomial regression model
model <- lm(y~poly(x, 2), data=df)

#define new sequence of x-values
new_x <- seq(min(df$x), max(df$y))

#create scatterplot of x vs. y values
plot(y~x, data=df)

#attempt to plot fitted regression line
lines(new_x, predict(model, newdata = data. frame (x=new_x)))
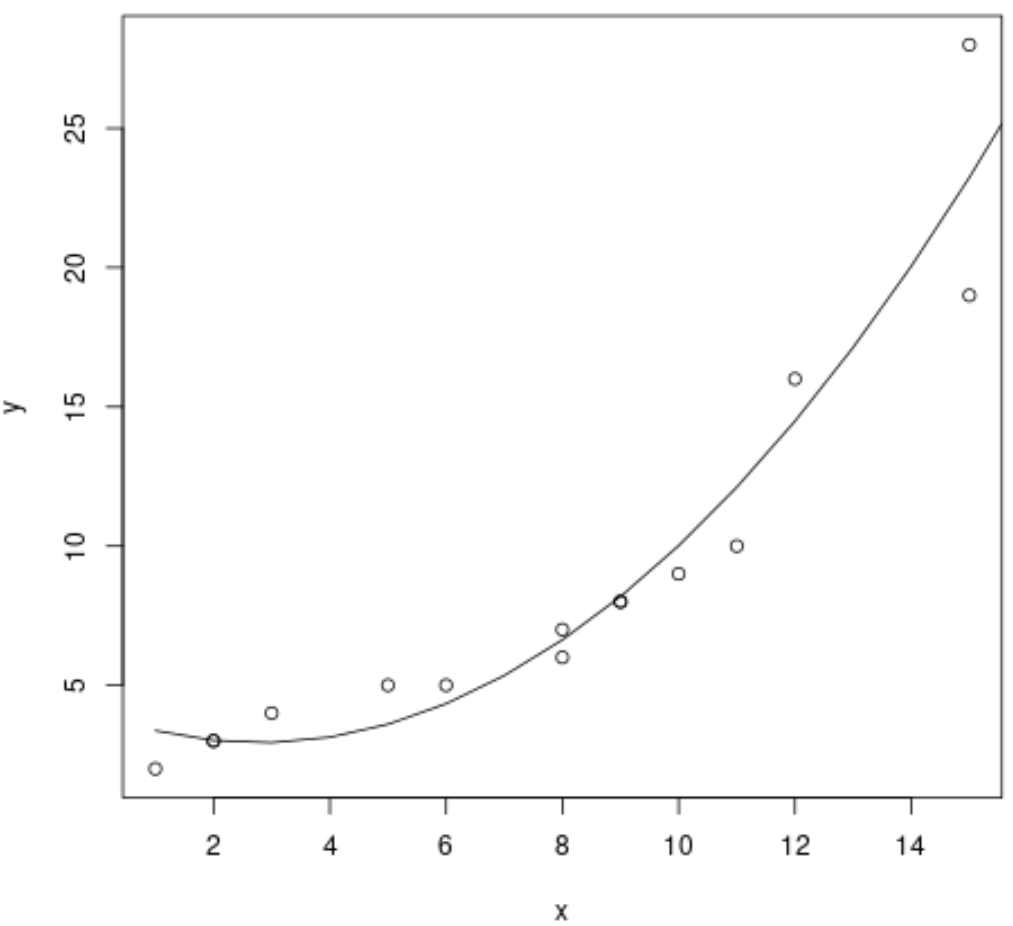
လိုင်း() လုပ်ဆောင်ချက်ကို အသုံးမပြုမီ plot() လုပ်ဆောင်ချက်ကို ဦးစွာအသုံးပြုခဲ့ခြင်းကြောင့် အမှားအယွင်းတစ်ခု လက်ခံရရှိခြင်းမရှိကြောင်း သတိပြုပါ။
ဥပမာ 2- abline() ဖြင့် အမှားတစ်ခုကို ဘယ်လိုပြင်ရမလဲ။
R တွင် အလျားလိုက်မျဉ်းဖြောင့်ဖြင့် scatterplot တစ်ခုကို ဖန်တီးရန် ကြိုးစားနေသည် ဆိုပါစို့။
 #create data
df <- data. frame (x=c(1, 2, 2, 3, 5, 6, 8, 8, 9, 9, 10, 11, 12, 15, 15),
                 y=c(2, 3, 3, 4, 5, 5, 6, 7, 8, 8, 9, 10, 16, 19, 28))

#attempt to add horizontal line at y=10
abline(a=10, b=0, lwd=2)

Error in plot.xy(xy.coords(x, y), type = type, ...):
  plot.new has not been called yet
R တွင် ကွက်ကွက်တစ်ခုကို ဦးစွာမဖန်တီးဘဲ abline() လုပ်ဆောင်ချက်ကို အသုံးမပြုနိုင်သောကြောင့် ကျွန်ုပ်တို့သည် အမှားအယွင်းတစ်ခုကို လက်ခံရရှိနေပါသည်။
ဤအမှားကိုပြင်ရန်၊ ကျွန်ုပ်တို့သည် ဦးစွာ scatter plot ကိုဖန်တီးပြီးနောက် abline() လုပ်ဆောင်ချက်ကို အသုံးပြုနိုင်ပါသည်။
 #createdata
df <- data. frame (x=c(1, 2, 2, 3, 5, 6, 8, 8, 9, 9, 10, 11, 12, 15, 15),
                 y=c(2, 3, 3, 4, 5, 5, 6, 7, 8, 8, 9, 10, 16, 19, 28))

#create scatterplot of x vs. y
plot(y~x, data=df)

#add horizontal line at y=10
abline(a=10, b=0, lwd=2)
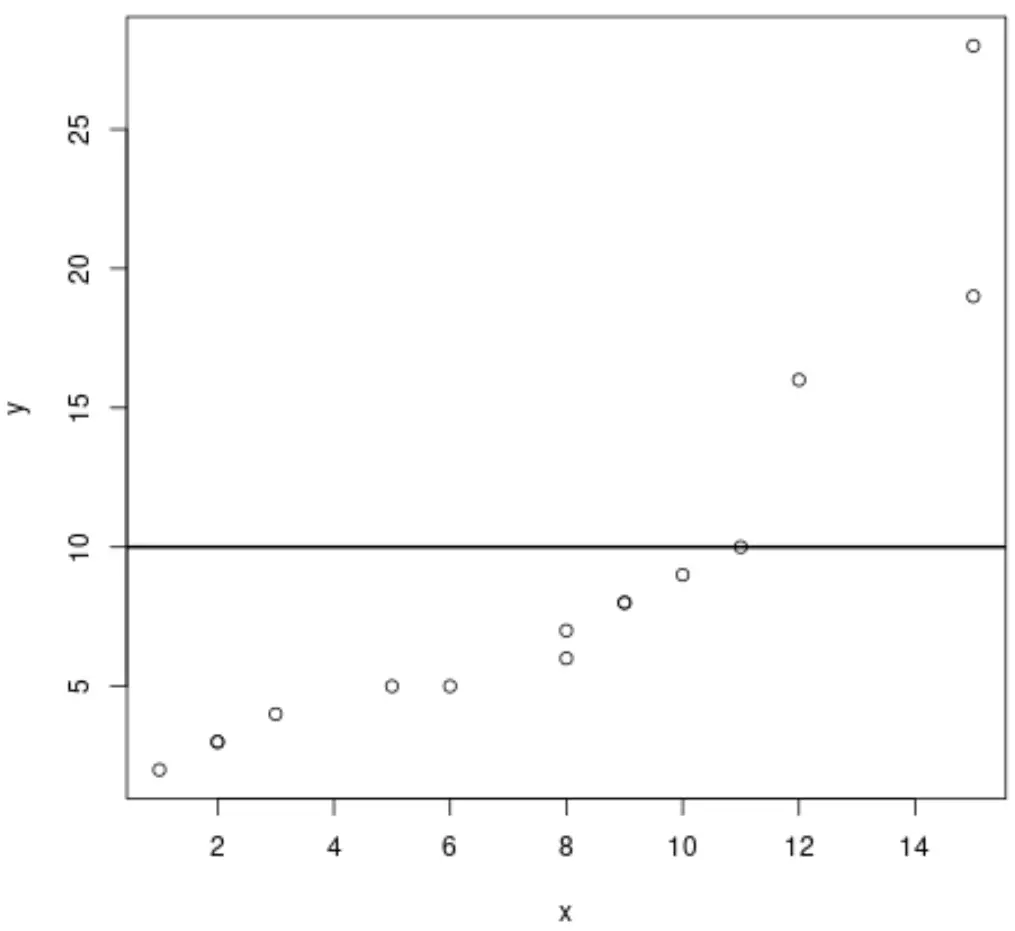
abline() လုပ်ဆောင်ချက်ကို အသုံးမပြုမီ ကျွန်ုပ်တို့သည် plot() လုပ်ဆောင်ချက်ကို ဦးစွာအသုံးပြုထားသောကြောင့် အမှားအယွင်းတစ်ခု လက်ခံရရှိခြင်းမရှိကြောင်း သတိပြုပါ။
ဆက်စပ်- လမ်းကြောင်းများသို့ မျဉ်းဖြောင့်များထည့်ရန် R တွင် aline() ကို အသုံးပြုနည်း
ထပ်လောင်းအရင်းအမြစ်များ
အောက်ဖော်ပြပါ သင်ခန်းစာများသည် R တွင် အခြားသော ဘုံအမှားများကို မည်သို့ပြင်ဆင်ရမည်ကို ရှင်းပြထားပါသည်။
R တွင် ပြုပြင်နည်း- မျှော်လင့်မထားသော စာကြောင်း ကိန်းသေ
R တွင် ပြင်ဆင်နည်း- ExtractVars ရှိ မမှန်ကန်သော နမူနာပုံစံဖော်မြူလာ
R- argument သည် ကိန်းဂဏာန်းမဟုတ်သလို ယုတ္တိလည်းမဟုတ်- return na
စာရေးသူအကြောင်း
Benjamin Anderson
မင်္ဂလာပါ၊ ကျွန်ုပ်သည် အငြိမ်းစား စာရင်းအင်း ပါမောက္ခ ဘင်ဂျမင်ဖြစ်ပြီး သီးသန့် Statorials ဆရာအဖြစ် လှည့်ပတ်ပါသည်။ စာရင်းဇယားနယ်ပယ်တွင် ကျယ်ပြန့်သောအတွေ့အကြုံနှင့် ကျွမ်းကျင်မှုနှင့်အတူ၊ Statorials မှတစ်ဆင့် ကျောင်းသားများကို ခွန်အားဖြစ်စေရန်အတွက် ကျွန်ုပ်၏အသိပညာကို မျှဝေလိုပါသည်။ ပိုသိတယ်။