
Pandas : Comment annoter des barres dans un tracé à barres
Vous pouvez utiliser les méthodes suivantes pour annoter les barres dans un tracé à barres pandas :
Méthode 1 : Annoter les barres dans un tracé à barres simple
ax = df.plot.bar()

ax.bar_label(ax.containers[0])
Méthode 2 : Annoter les barres dans un tracé à barres groupées
ax = df.plot.bar()

for container in ax.containers:
    ax.bar_label(container)
Les exemples suivants montrent comment utiliser chaque méthode dans la pratique.
Exemple 1 : Annoter des barres dans un tracé à barres simple
Le code suivant montre comment annoter des barres dans un simple tracé à barres :
import pandas as pd

#create DataFrame
df = pd.DataFrame({'product': ['A', 'B', 'C', 'D', 'E'],
                   'sales': [4, 7, 8, 15, 12]})

#view DataFrame
print(df)

  product  sales
0       A      4
1       B      7
2       C      8
3       D     15
4       E     12

#create bar plot to visualize sales by product
ax = df.plot.bar(x='product', y='sales', legend=False)

#annotate bars
ax.bar_label(ax.containers[0])
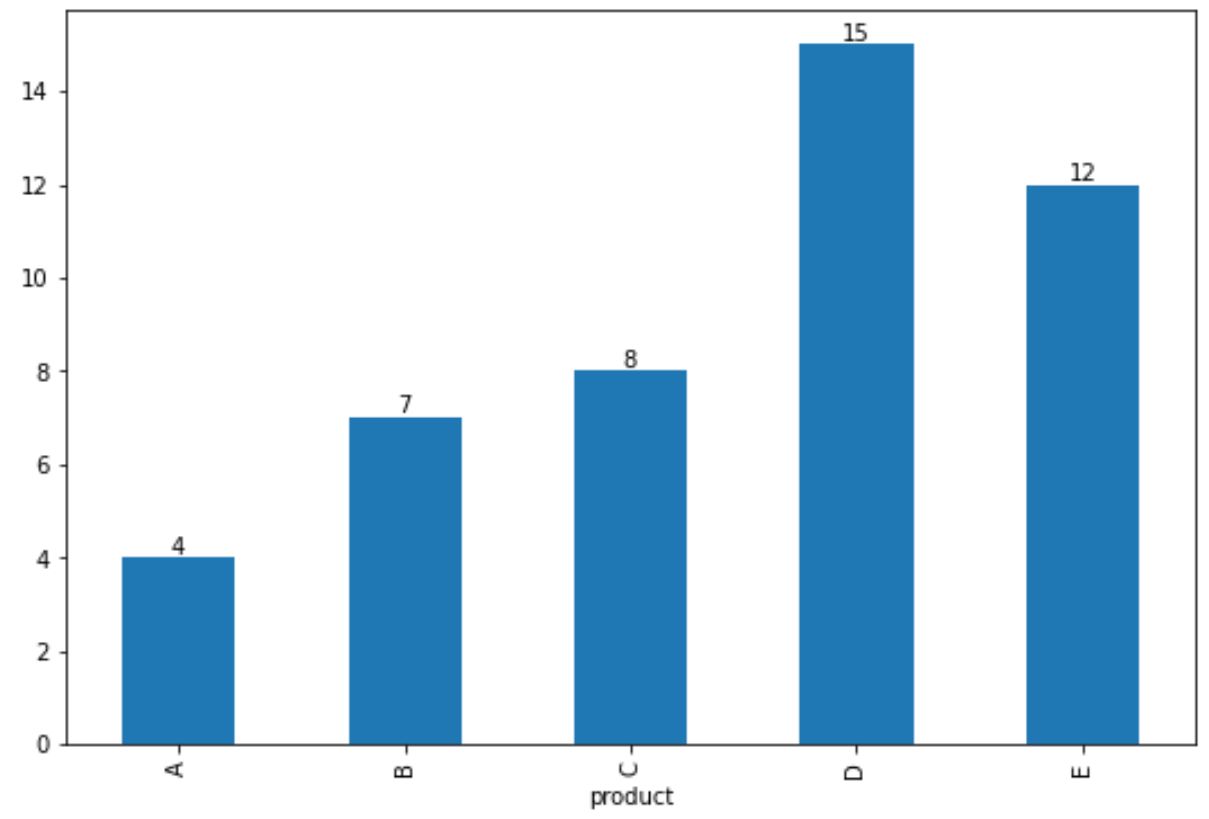
Notez que la valeur réelle des ventes est affichée en haut de chaque barre.
Exemple 2 : Annoter des barres dans un tracé à barres groupées
Le code suivant montre comment annoter les barres dans un tracé à barres groupées :
#create DataFrame
df = pd.DataFrame({'productA': [14, 10],
                   'productB': [17, 19]},
                    index=['store 1', 'store 2'])

#view DataFrame
print(df)

         productA  productB
store 1        14        17
store 2        10        19

#create grouped bar plot
ax = df.plot.bar()

#annotate bars in bar plot
for container in ax.containers:
    ax.bar_label(container)
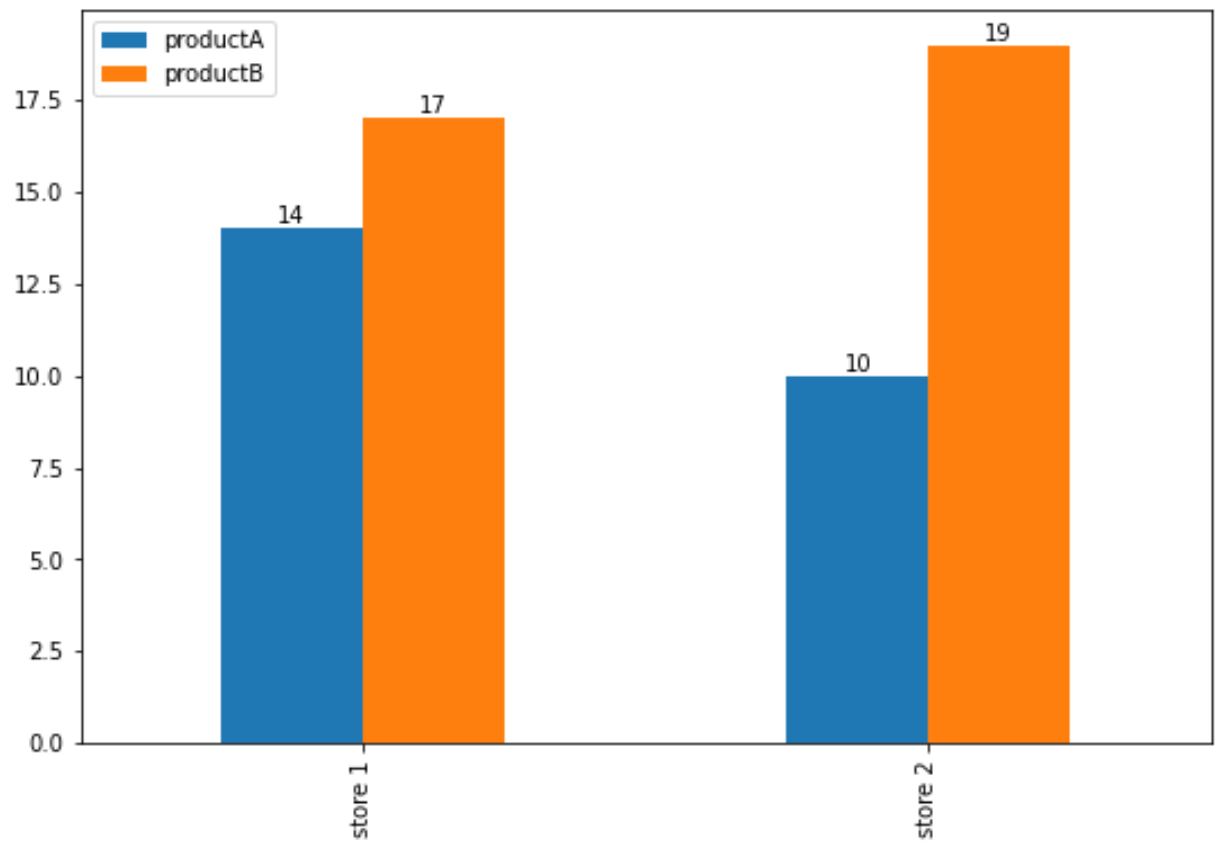
Notez que des annotations ont été ajoutées à chaque barre individuelle du tracé.
Ressources additionnelles
Les didacticiels suivants expliquent comment créer d’autres visualisations courantes dans les pandas :
Comment créer un boxplot à partir de Pandas DataFrame
Comment créer un diagramme circulaire à partir de Pandas DataFrame
Comment créer un histogramme à partir de Pandas DataFrame
à propos de l'auteur
Dr. Benjamin Anderson
Il est un professeur de statistiques à la retraite devenu éducateur dévoué sur Statorials. Avec une vaste expérience et une expertise dans le domaine des statistiques, je m'engage à partager mes connaissances pour responsabiliser les étudiants grâce à Statorials. Lire plus