
Comment créer un tableau avec Matplotlib
Vous pouvez utiliser l’une des deux méthodes suivantes pour créer des tables en Python à l’aide de Matplotlib :
Méthode 1 : Créer une table à partir du DataFrame pandas
#create pandas DataFrame
df = pd.DataFrame(np.random.randn(20, 2), columns=['First', 'Second'])

#create table
table = ax.table(cellText=df.values, colLabels=df.columns, loc='center')
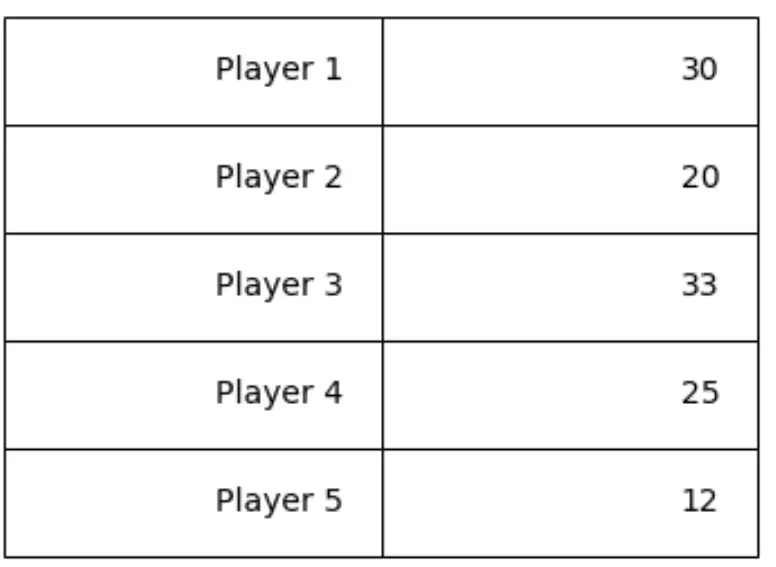
Méthode 2 : créer un tableau à partir de valeurs personnalisées
#create values for table
table_data=[
    ["Player 1", 30],
    ["Player 2", 20],
    ["Player 3", 33],
    ["Player 4", 25],
    ["Player 5", 12]
]

#create table
table = ax.table(cellText=table_data, loc='center')
Ce didacticiel fournit des exemples d’utilisation pratique de ces méthodes.
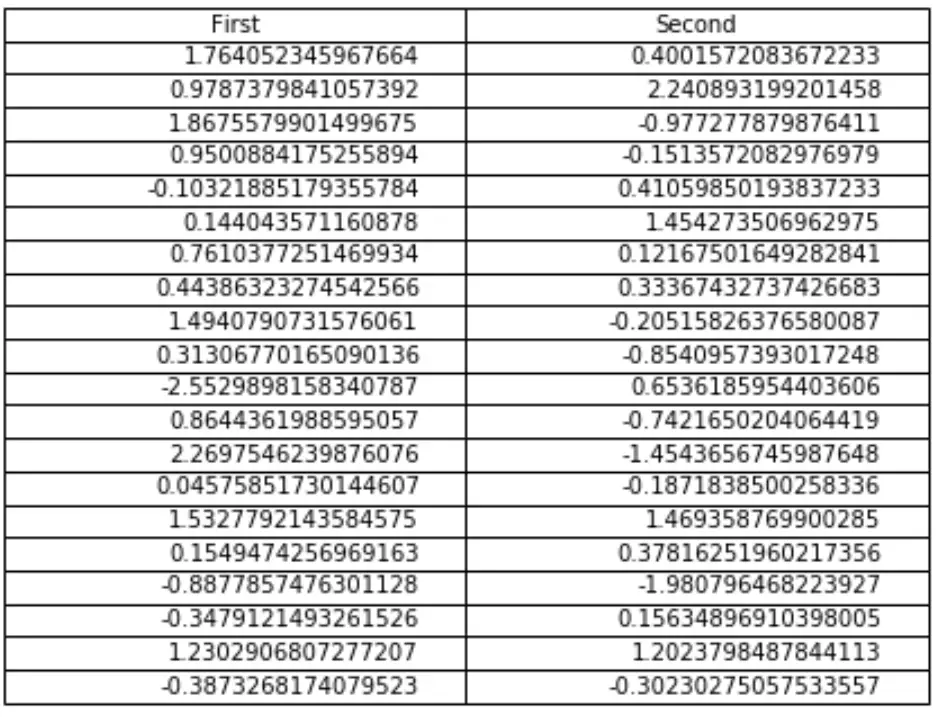
Exemple 1 : Créer une table à partir du DataFrame pandas
Le code suivant montre comment créer une table dans Matplotlib contenant les valeurs d’un DataFrame pandas :
import numpy as np
import pandas as pd
import matplotlib.pyplot as plt

#make this example reproducible
np.random.seed(0)

#define figure and axes
fig, ax = plt.subplots()

#hide the axes
fig.patch.set_visible(False)
ax.axis('off')
ax.axis('tight')

#create data
df = pd.DataFrame(np.random.randn(20, 2), columns=['First', 'Second'])

#create table
table = ax.table(cellText=df.values, colLabels=df.columns, loc='center')

#display table
fig.tight_layout()
plt.show()
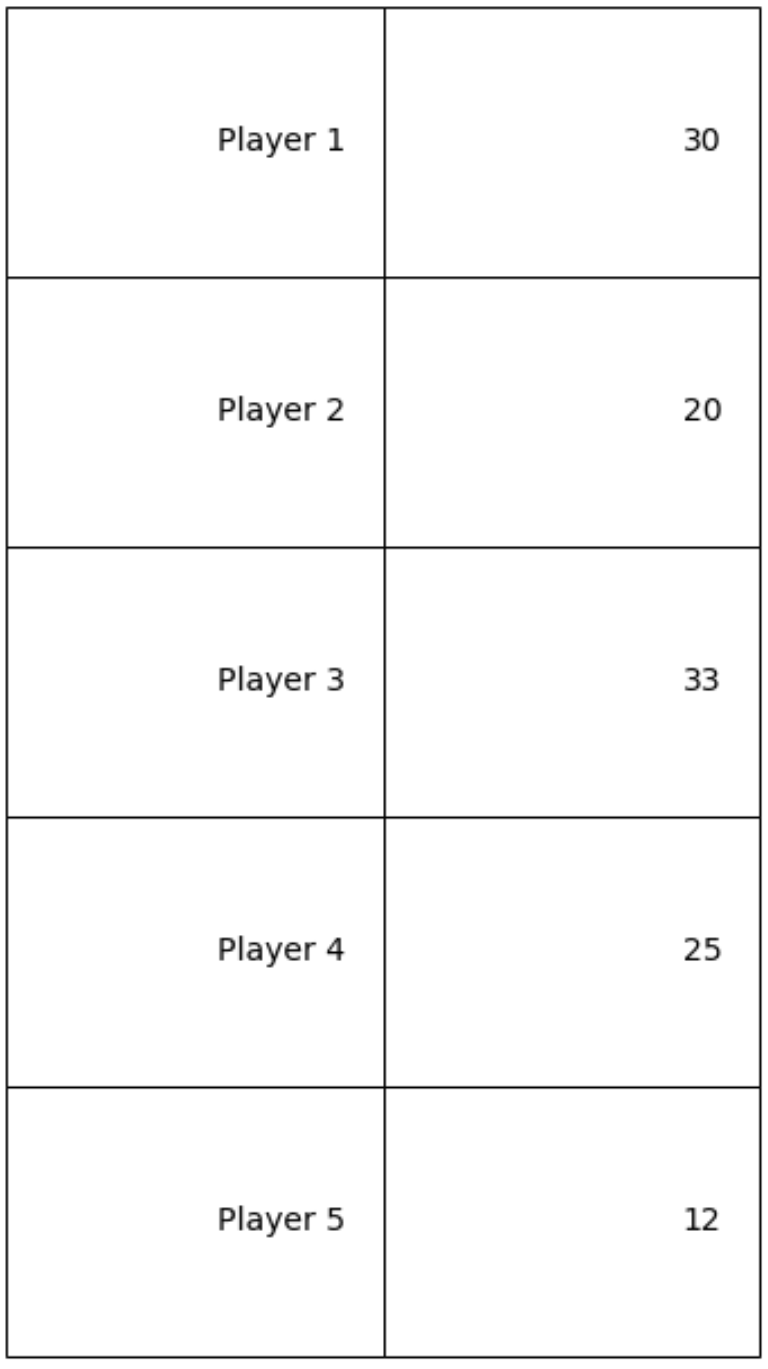
Exemple 2 : Créer une table à partir de valeurs personnalisées
Le code suivant montre comment créer une table dans Matplotlib contenant des valeurs personnalisées :
import numpy as np
import pandas as pd
import matplotlib.pyplot as plt

#define figure and axes
fig, ax = plt.subplots()

#create values for table
table_data=[
    ["Player 1", 30],
    ["Player 2", 20],
    ["Player 3", 33],
    ["Player 4", 25],
    ["Player 5", 12]
]

#create table
table = ax.table(cellText=table_data, loc='center')

#modify table
table.set_fontsize(14)
table.scale(1,4)
ax.axis('off')

#display table
plt.show()
Notez que table.scale(width, length) modifie la largeur et la longueur du tableau. Par exemple, nous pourrions allonger encore le tableau en modifiant la longueur :
table.scale(1,10)
Ressources additionnelles
Comment ajouter du texte aux tracés Matplotlib
Comment définir le rapport hauteur/largeur dans Matplotlib
Comment changer la taille de la police de la légende dans Matplotlib
à propos de l'auteur
Dr. Benjamin Anderson
Il est un professeur de statistiques à la retraite devenu éducateur dévoué sur Statorials. Avec une vaste expérience et une expertise dans le domaine des statistiques, je m'engage à partager mes connaissances pour responsabiliser les étudiants grâce à Statorials. Lire plus