
Comment ajuster la taille de la sous-parcelle dans Matplotlib
Vous pouvez utiliser la syntaxe suivante pour ajuster la taille des sous-parcelles dans Matplotlib :
#specify one size for all subplots
fig, ax = plt.subplots(2, 2, figsize=(10,7))

#specify individual sizes for subplots
fig, ax = plt.subplots(1, 2, gridspec_kw={'width_ratios': [3, 1]})
Les exemples suivants montrent comment utiliser cette syntaxe dans la pratique.
Exemple 1 : Spécifier une taille pour toutes les sous-parcelles
Le code suivant montre comment spécifier une taille pour tous les sous-tracés :
import matplotlib.pyplot as plt

#define subplots
fig, ax = plt.subplots(2, 2, figsize=(10,7))
fig.tight_layout()

#define data
x = [1, 2, 3]
y = [7, 13, 24]

#create subplots
ax[0, 0].plot(x, y, color='red')
ax[0, 1].plot(x, y, color='blue')
ax[1, 0].plot(x, y, color='green')
ax[1, 1].plot(x, y, color='purple')
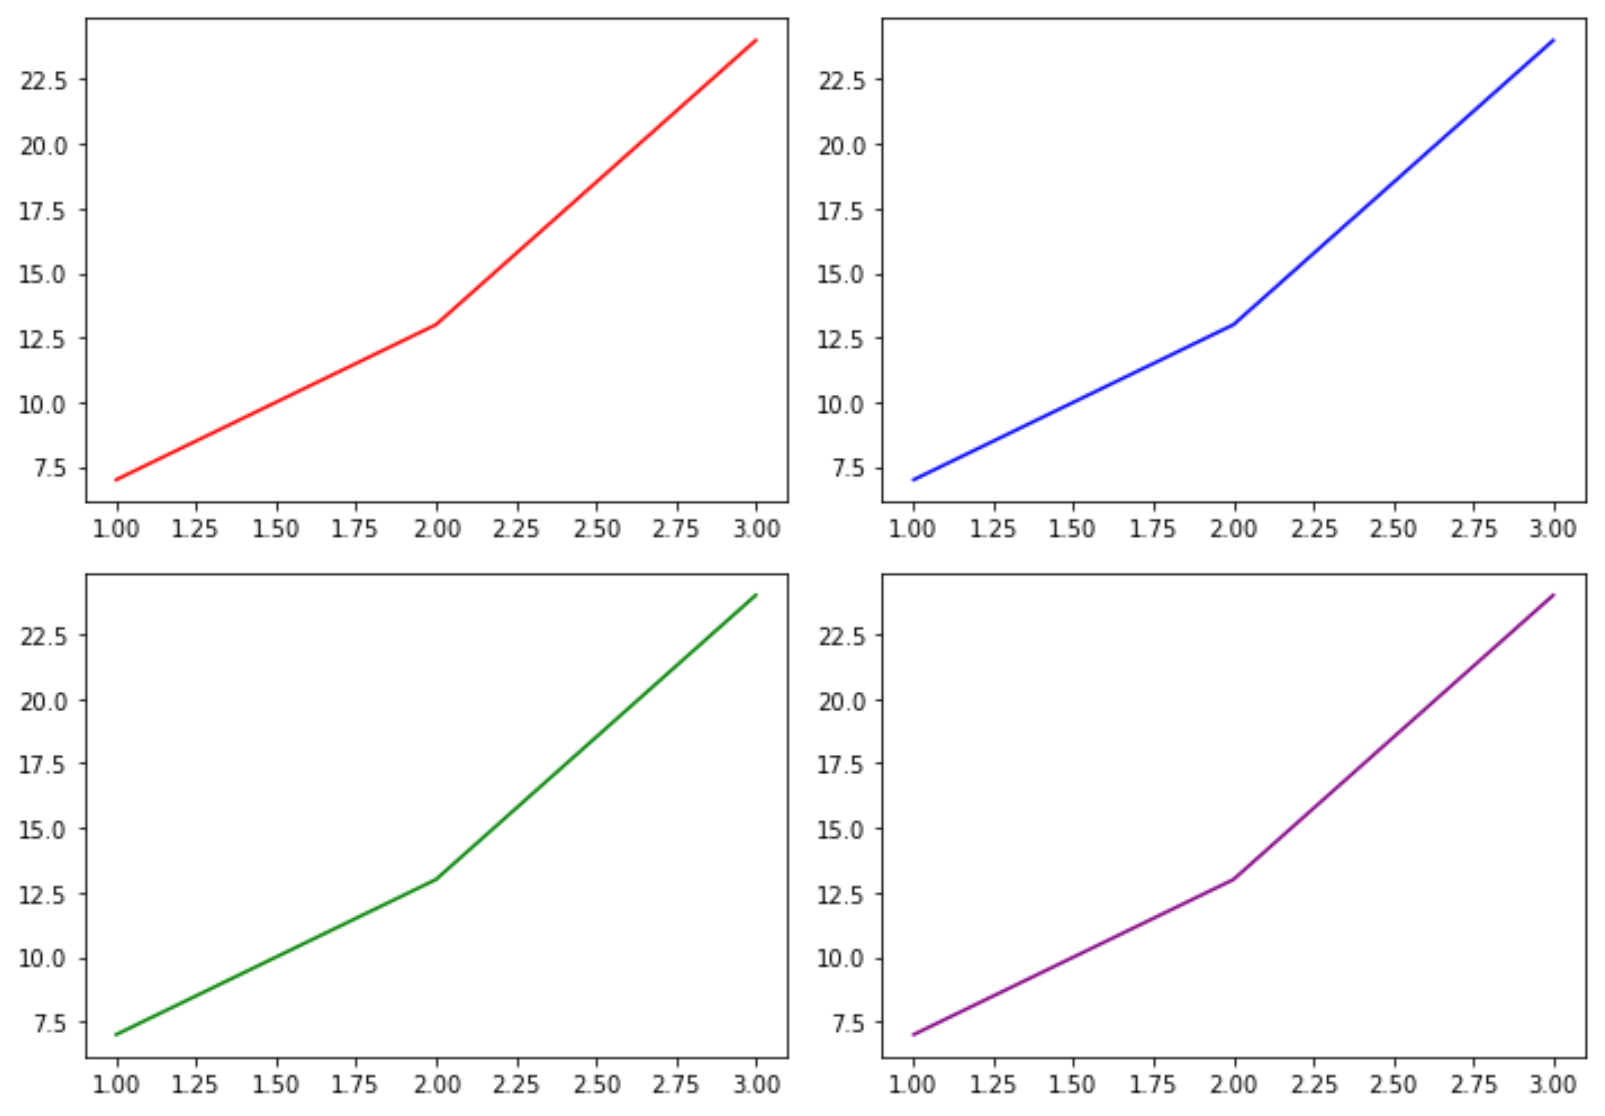
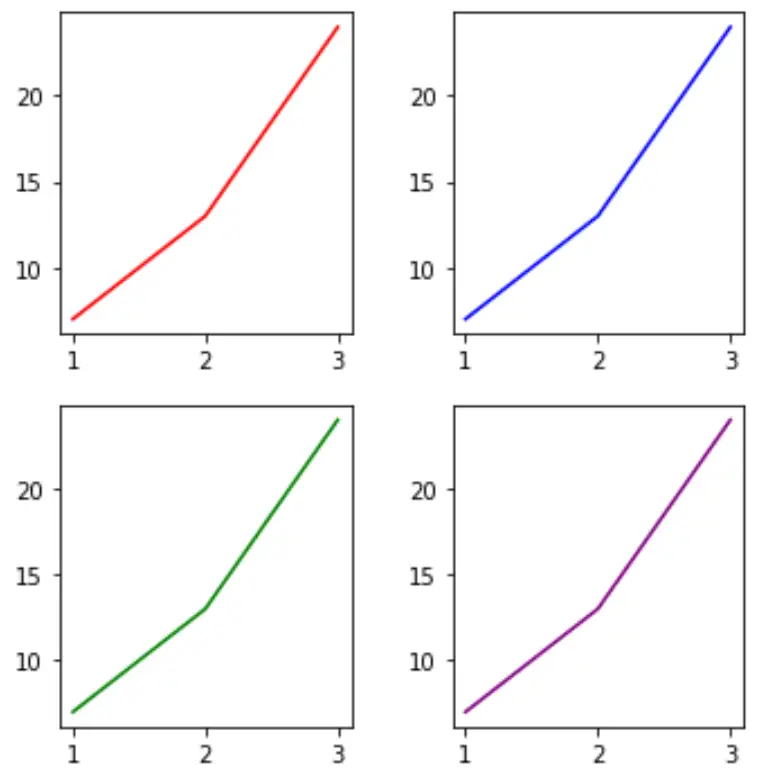
Nous pouvons facilement modifier la taille des sous-traces en modifiant les valeurs de l’argument figsize :
import matplotlib.pyplot as plt

#define subplots
fig, ax = plt.subplots(2, 2, figsize=(5,5))
fig.tight_layout()

#define data
x = [1, 2, 3]
y = [7, 13, 24]

#create subplots
ax[0, 0].plot(x, y, color='red')
ax[0, 1].plot(x, y, color='blue')
ax[1, 0].plot(x, y, color='green')
ax[1, 1].plot(x, y, color='purple')
Exemple 2 : spécifier les tailles des sous-parcelles individuelles
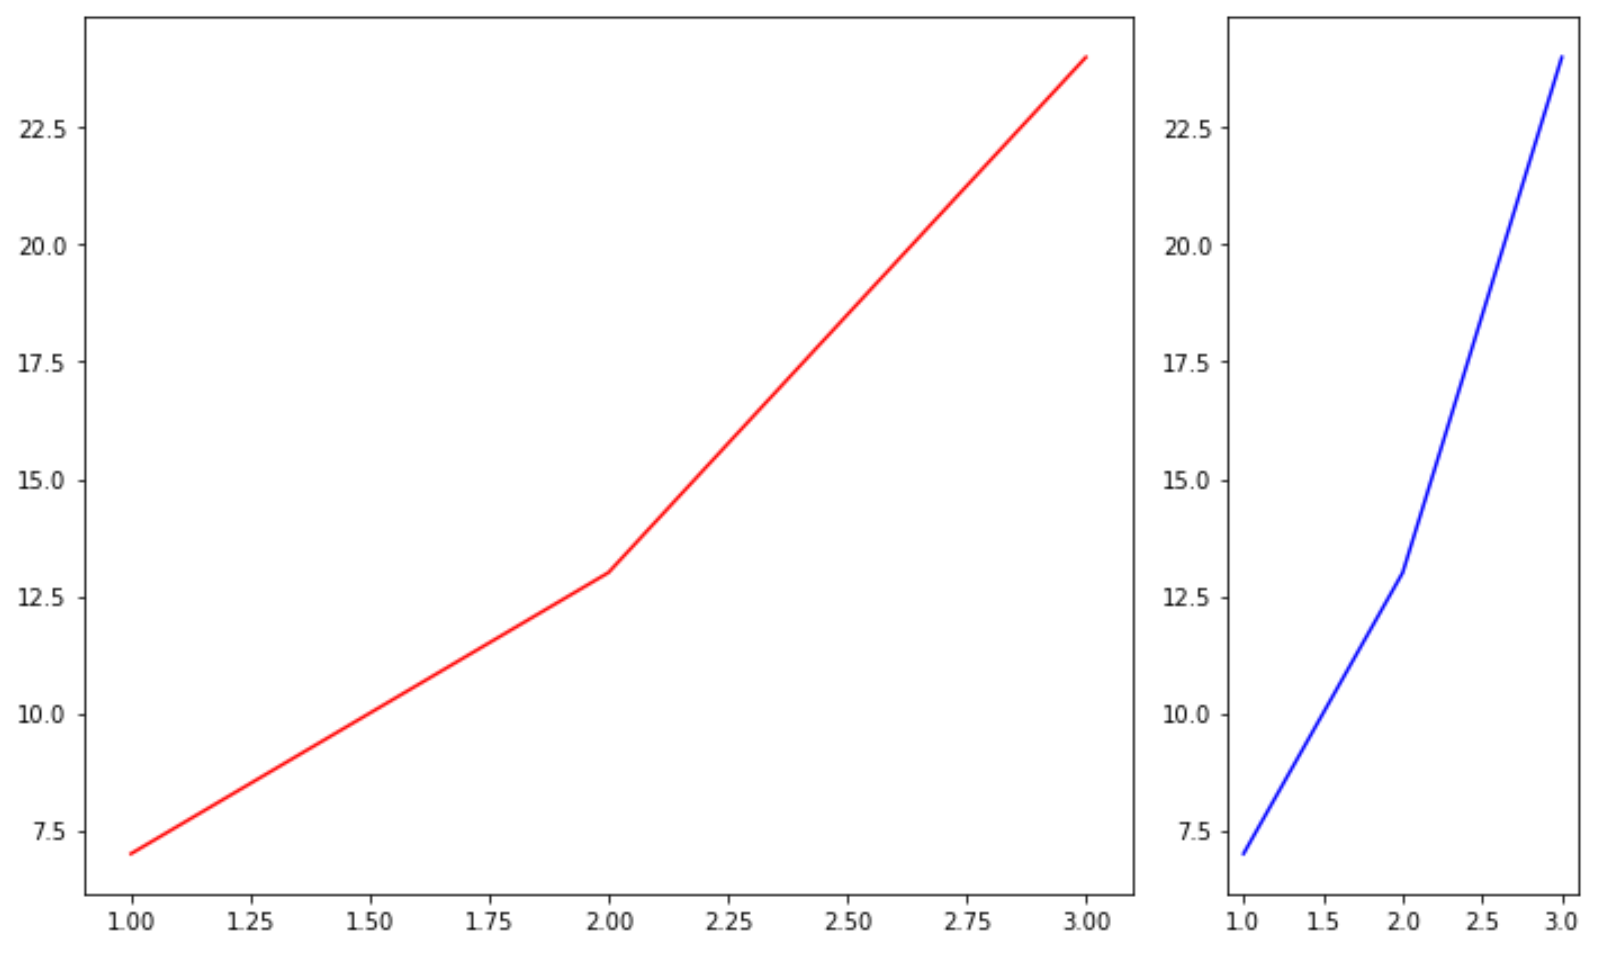
Le code suivant montre comment spécifier différentes tailles pour des sous-tracés individuels :
import matplotlib.pyplot as plt

#define subplots
fig, ax = plt.subplots(1, 2, gridspec_kw={'width_ratios': [3, 1]})
fig.tight_layout()

#define data
x = [1, 2, 3]
y = [7, 13, 24]

#create subplots
ax[0].plot(x, y, color='red')
ax[1].plot(x, y, color='blue')
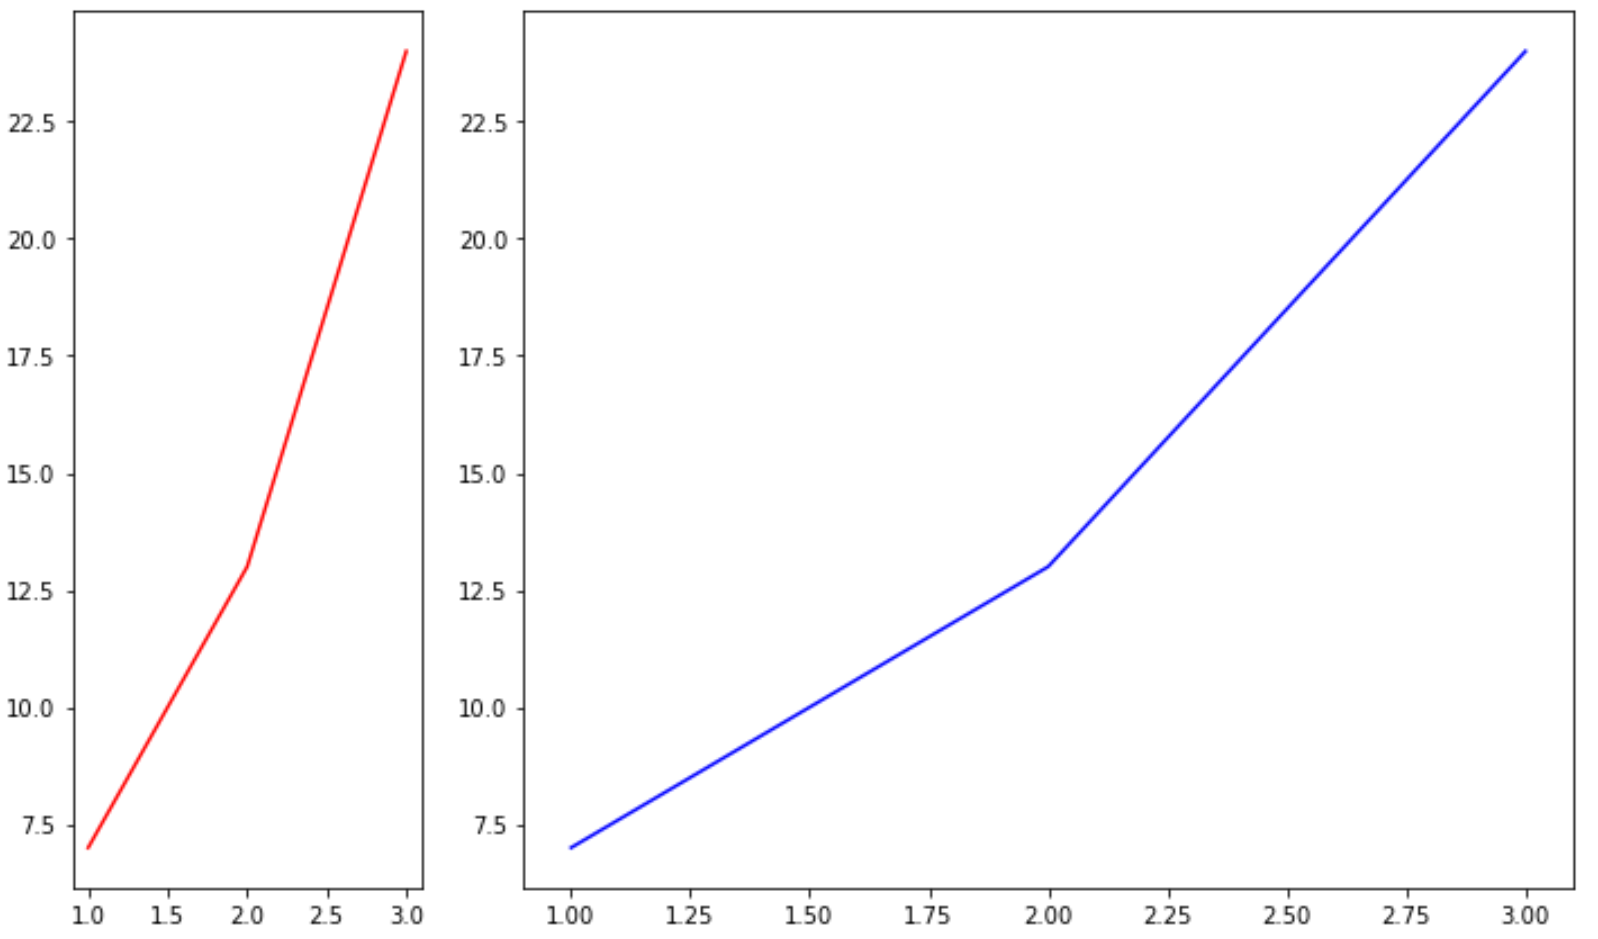
Nous pouvons facilement modifier la taille des sous-traces en modifiant les valeurs dans l’argument width_ratios :
import matplotlib.pyplot as plt

#define subplots
fig, ax = plt.subplots(1, 2, gridspec_kw={'width_ratios': [1, 3]})
fig.tight_layout()

#define data
x = [1, 2, 3]
y = [7, 13, 24]

#create subplots
ax[0].plot(x, y, color='red')
ax[1].plot(x, y, color='blue')
Ressources additionnelles
Comment ajouter des titres aux tracés dans Matplotlib
Comment définir les plages d’axes dans Matplotlib
Comment définir les valeurs de l’axe X dans Matplotlib
à propos de l'auteur
Dr. Benjamin Anderson
Il est un professeur de statistiques à la retraite devenu éducateur dévoué sur Statorials. Avec une vaste expérience et une expertise dans le domaine des statistiques, je m'engage à partager mes connaissances pour responsabiliser les étudiants grâce à Statorials. Lire plus